| Examining Distributions |
Examining Distributions
In Chapter 4, "Exploring Data in One Dimension," you examined distributions using bar charts and box plots. In this chapter, you examine the distribution of an interval variable using graphs and statistical tables.
You can examine box plots and histograms of the data along with Moments and Quantiles tables. You can superimpose density curves on the histogram. You can carry out tests to determine whether the data are from specific parametric distributions, such as normal or lognormal.
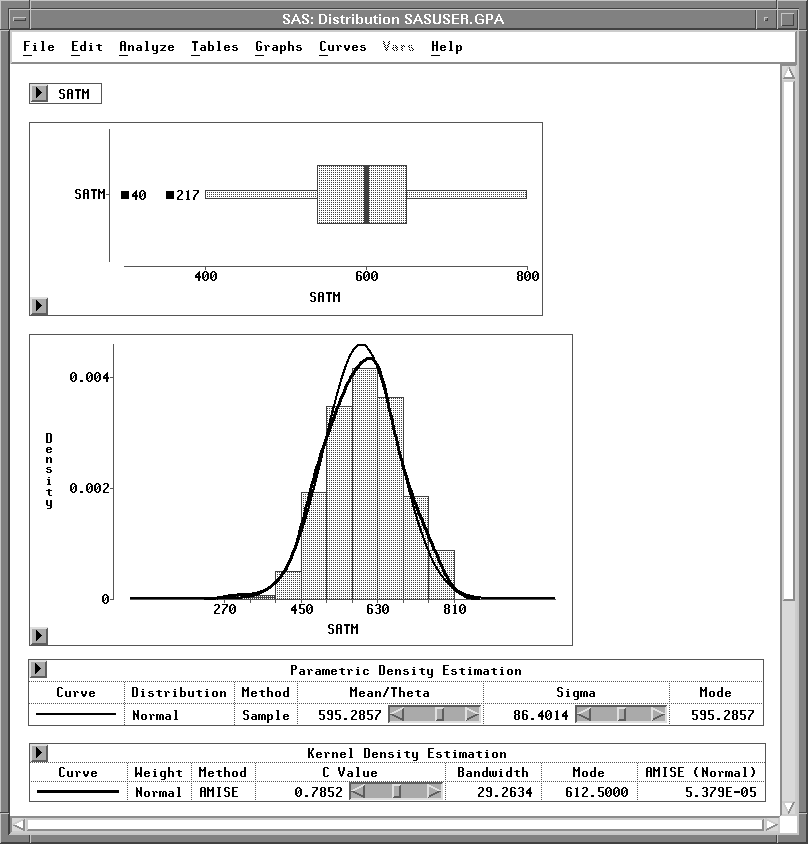
Figure 12.1: Distribution Analysis