| Examining Distributions |
Creating the Distribution Analysis
The distribution of a variable is the pattern of variation of its numerical values (Moore and McCabe 1989). In this example, you examine a distribution of scores on the mathematics portion of the SAT exam.| Open the GPA data set. |
| Select the variable SATM by clicking on its name in the data window. |
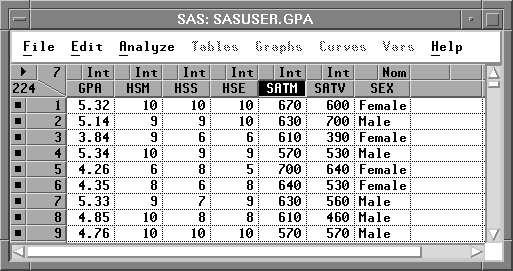
Figure 12.2: Data Window with SATM Selected
| Choose Analyze:Distribution ( Y ). |
![[menu]](images/exd_exdeq1.gif)
This creates a distribution window, as shown in Figure 12.4. A box plot, histogram, Moments table, and Quantiles table appear by default. With these graphs and tables, you can examine important features of a distribution.
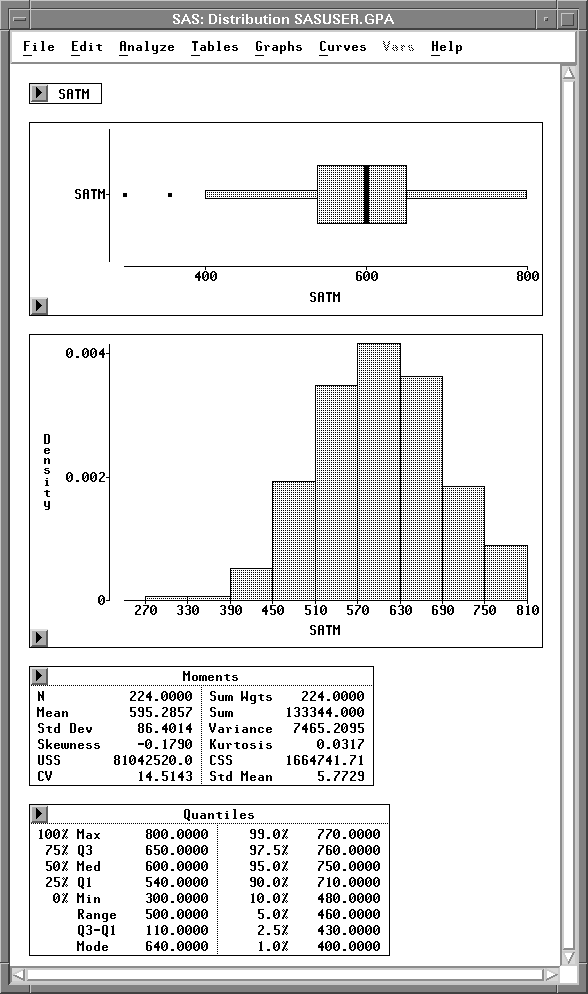
Figure 12.4: Distribution Analysis
Box Plot
Histogram
Moments and Quantiles Tables
Copyright © 2007 by SAS Institute Inc., Cary, NC, USA. All rights reserved.