| Examining Distributions |
Histogram
A histogram is a bar chart of an interval variable. In a histogram, the interval represented by a bar is called a bin. Instead of a frequency axis, histograms in a distribution analysis use a density axis to measure the fractional distribution over a given interval.
Examine the histogram of SATM. The shape of the distribution is fairly symmetric except for slight skewing in the left tail. The distribution's center is around 600.
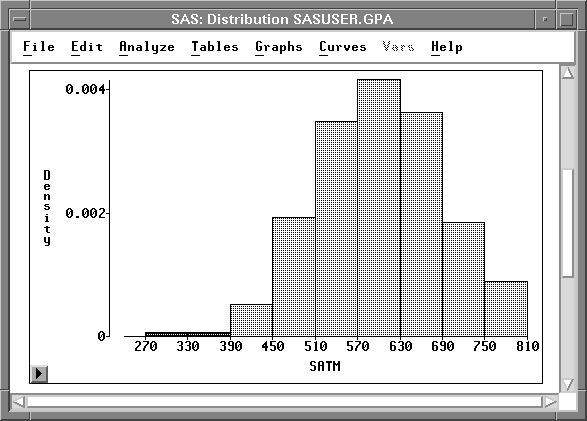
Figure 12.8: Histogram of SATM
A histogram is a good tool for visually examining the distribution. However, changes in the width and position of the bars can greatly affect your perception of the shape of the distribution. The histogram illustrated in Figure 12.8 is only one representation of the distribution of SATM. It is easy to change the bar widths and positions with SAS/INSIGHT software to explore many different histograms.
| Choose Edit:Windows:Tools. |
This displays the tools window, as shown in Figure 12.9.
| Click on the hand in the tools window. |
The cursor changes shape from an arrow to a hand.
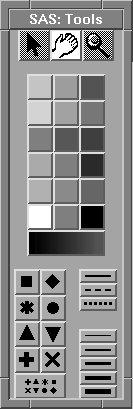
Figure 12.9: Tools Window
| Move the cursor back to the distribution window and click on the histogram. |
This changes the width of the bars in proportion to the distance of the hand tool from the base of the bars. If the hand tool is close to the base of the bars, the bars are wide, as shown in Figure 12.10.
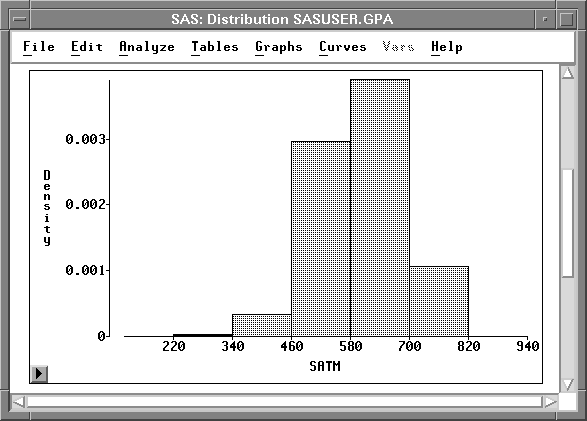
Figure 12.10: Clicking Close to the Base of the Bars
If the hand tool is far from the base of the bars, clicking makes the bars narrow, as shown in Figure 12.11.
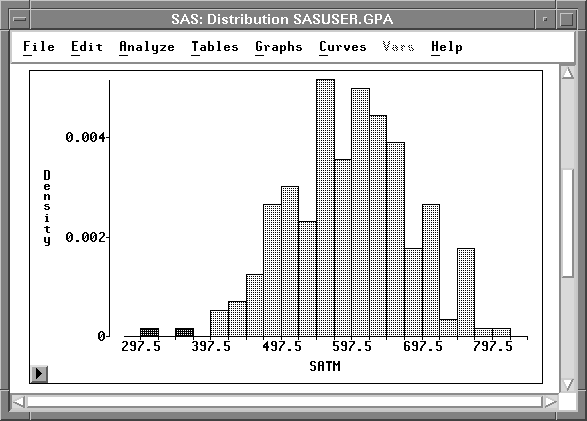
Figure 12.11: Clicking Far from the Base of the Bars
| Press the mouse button and hold it down as you move horizontally over the bars. |
Notice how the histogram changes as you move the hand. As you move horizontally, the bin width does not change, but the bins start at different locations. When the hand is at the left of the histogram, the bins start at an integral multiple of the bin width. When the hand moves toward the right, the bins are offset an amount proportional to the distance of the hand across the histogram.
| Drag the hand horizontally and vertically in the histogram. |
Release the mouse button when you find a histogram that captures the dominant shape of the distribution.
| Click on the arrow in the tools window before proceeding. |
Related Reading |
Bar Charts, Chapter 32. |
Copyright © 2007 by SAS Institute Inc., Cary, NC, USA. All rights reserved.