| Examining Distributions |
Moments and Quantiles Tables
The Moments and Quantiles tables give descriptive information that quantifies what you observe in the box plot and histogram.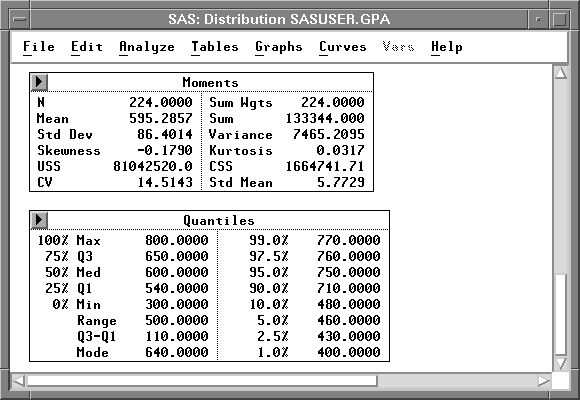
Figure 12.12: Moments and Quantiles Tables
In the Moments table, N is the number of nonmissing observations, Mean is the arithmetic mean, Std Dev is the standard deviation, and Variance is the variance. Skewness and Kurtosis are both measures of the shape of the distribution.
Skewness is a measure of the tendency of the deviations from the mean to be larger in one direction than in the other. A positive value for Skewness indicates that the data are skewed to the right. A negative value indicates that the data are skewed to the left. The distribution of SATM is skewed slightly to the left, as you observed previously; thus, the value for Skewness is negative.
Kurtosis is primarily a measure of the heaviness of the tails of a distribution. Large values of Kurtosis indicate that the distribution has heavy tails. This statistic is standardized so that a normal distribution has a kurtosis of 0.
The Quantiles table gives information about the variability in the data as well as about the center of the data. Two distributions having the same center can look quite different if the variability in the two distributions is different. This variability is shown by the percentiles in the Quantiles table. The Quantiles table also shows the Range of the data, the interquartile range Q3-Q1, and the Mode.
Copyright © 2007 by SAS Institute Inc., Cary, NC, USA. All rights reserved.