| Histograms and Bar Charts |
Histograms and Bar Charts
Bar charts are pictorial representations of the distribution of values of a variable.
You can use bar charts to show distributions of interval or nominal variables. Bar charts of interval variables are also called histograms.
You can label the heights of the bars in a bar chart, control the orientation, and control the information shown on the axes. For bar charts of interval variables, you can also control the width and offset of the bars.
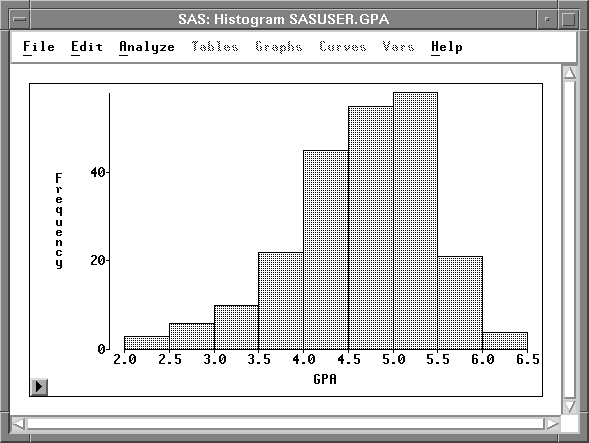
Figure 32.1: Bar Chart