| Histograms and Bar Charts |
Variables
To create a bar chart, choose Analyze:Histogram/Bar Chart ( Y ). Bar charts require a Y variable. If you have already selected one or more variables, they are assigned the Y variable role, and a bar chart is created for each selected variable. If you have not selected any variables, a variables dialog appears.
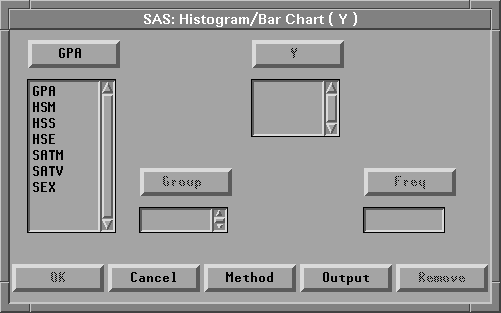
Figure 32.2: Bar Chart Variables Dialog
In the dialog, select at least one Y variable. A separate bar chart is created for each Y variable you select.
You can select one or more Group variables if you have grouped data. This creates one bar chart for each group.
You can select a Freq variable. If you select a Freq variable, each observation is assumed to represent n observations, where n is the value of the Freq variable.
Copyright © 2007 by SAS Institute Inc., Cary, NC, USA. All rights reserved.