| Histograms and Bar Charts |
Method
Observations with missing values for Y variables are not used. Observations with Freq values that are missing or that are less than or equal to 0 are not used. Only the integer part of Freq values is used.
For nominal variables, values that represent less than 4% of the total frequency are grouped together in an "Other" category by default. Clicking on the Method button in the variables dialog displays the dialog in Figure 32.3. This dialog enables you to change the threshold at which values are grouped into the Other category.
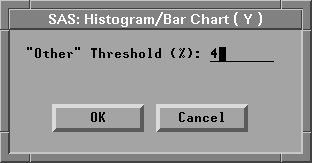
Figure 32.3: Bar Chart Method Options Dialog
For interval variables, values that fall on the boundary between two bars are added to the upper bar. For example, if two bars span ranges ( 1 to 2 ) and ( 2 to 3 ), the value 2 is considered to fall in the range ( 2 to 3 ).
By default, bar width and offset are calculated using an algorithm developed from Terrell and Scott (1985). Bar width is the distance along the Y axis represented by one bar. Bar offset is the distance from the start of the bar to the nearest multiple of the bar width. For example, if a bar starts at 1.2 and has a width of 1, then the offset is 0.2.
Copyright © 2007 by SAS Institute Inc., Cary, NC, USA. All rights reserved.