| Exploring Data in One Dimension |
Exploring Data in One Dimension
In SAS/INSIGHT software, you can explore distributions of one variable using bar charts and box plots. Bar charts display distributions of interval or nominal variables. Box plots display concise summaries of interval variable distributions and show extreme values.
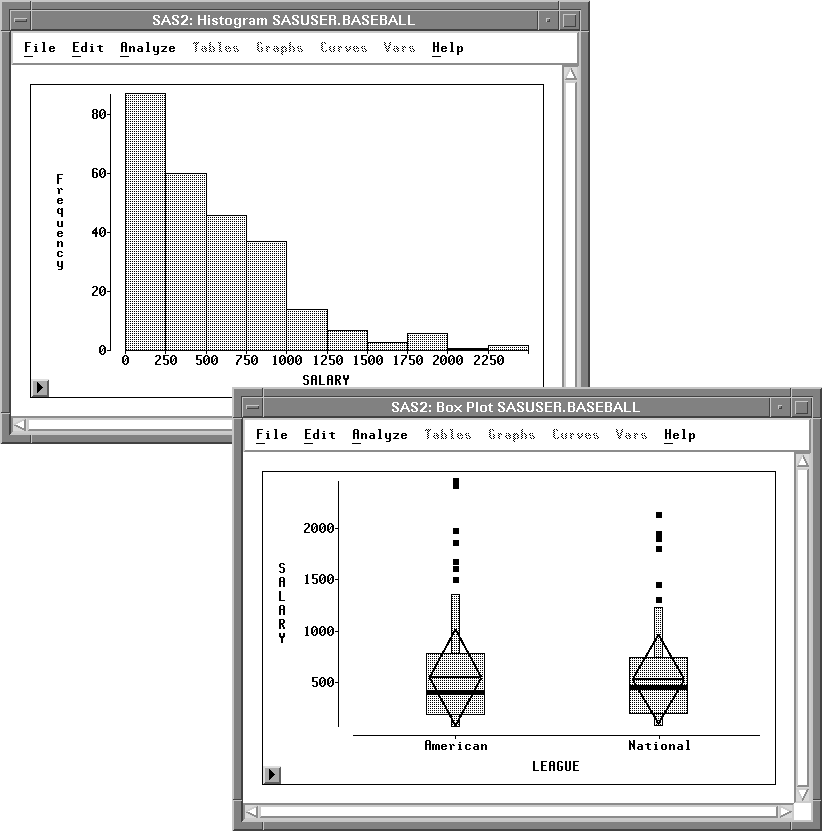
Figure 4.1: A Bar Chart and Box Plot