| Coloring Observations |
Multiple Color Blends
Color blending applies to all observations if none are selected. If observations are selected, color blending applies only to the selected observations. This enables you to assign multiple color blends for a single variable.
| Create a scatter plot of GPA versus SATV. |
| Create a blue-to-yellow blend in the tools window. |
Drag the blue color to the left end of the multiple colors button, and drag the yellow color to the right end.
| Select observations with values of GPA less than or equal to 4. |
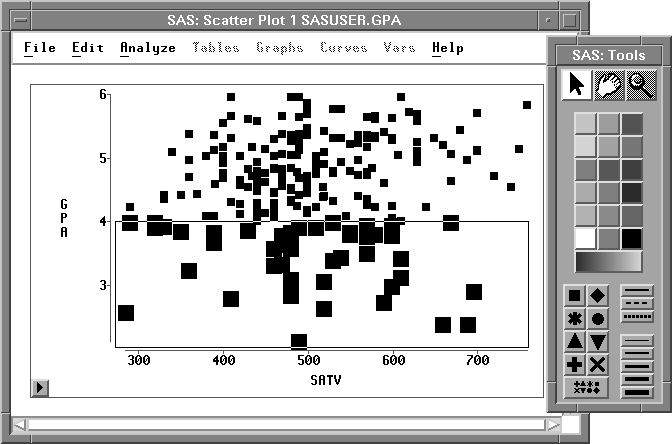
Figure 11.7: Selecting Observations Where GPA![]() 4
4
| Click the multiple colors button. |
This displays a variables dialog, as shown in Figure 11.8.
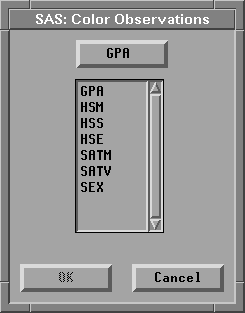
Figure 11.8: Variables Dialog
| In the variables dialog, select GPA, then click OK. |
This assigns the blue-to-yellow blend to observations with values of GPA less than or equal to 4.
You can use similar steps to assign a yellow-to-red blend to all observations with values of GPA greater than 4. To save time, select both observations and variables using extended selection instead of using the variables dialog.
| Create a yellow-to-red blend in the tools window. |
Drag the yellow color to the left end of the multiple colors button, and drag the red color to the right end.
| Select observations with values of GPA greater than or equal to 4. |
| Using extended selection, select the variable GPA. |
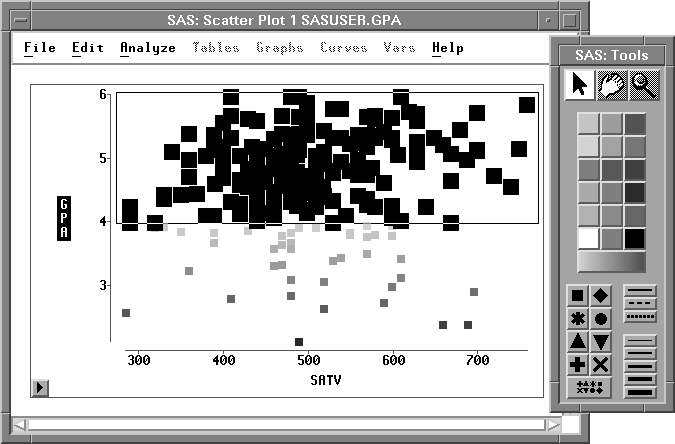
Figure 11.9: Selecting Variable GPA and Observations Where GPA![]() 4
4
| Click the multiple colors button. |
This assigns the yellow-to-red blend to observations with values of GPA greater than or equal to 4. Now all observations are assigned a color based on their value for GPA, with colors smoothly blended from blue through yellow to red.
Note |
In addition to the two-color blends described above, you can create a blended color strip based on the interpolation of up to five colors. |
To do this, follow these steps:
- Bring up the tools window by using Edit:Window:Tools.
- Choose a color in the tools window and place the cursor over that color button. For the sake of this example, choose the white button.
- Hold down the shift key.
- Shift-drag the white button onto the large multiple colors button.
- Release the mouse button while the cursor is in the middle of the multiple colors button. One of the existing colors that make up the multiple color button is replaced by white.
- You can further modify the color strip by shift-dragging other color buttons to varying positions along the length of the multiple color button.
Copyright © 2007 by SAS Institute Inc., Cary, NC, USA. All rights reserved.