| Coloring Observations |
Coloring Observations
You can assign the colors for displaying observations in plots. You can assign colors for the observations you select, and you can let SAS/INSIGHT software assign colors automatically based on the value of a variable.
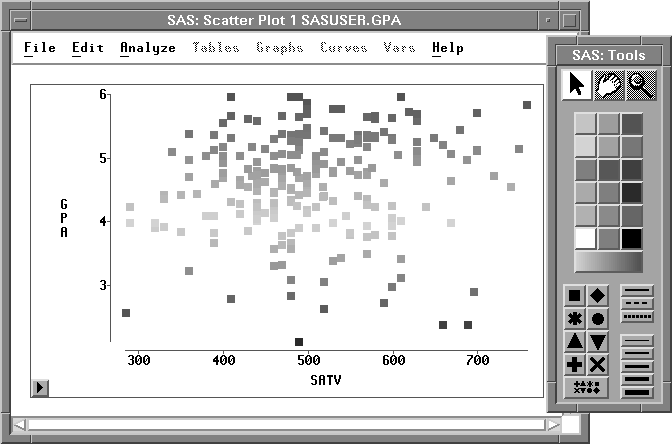
Figure 11.1: Coloring Observations