| Marking Observations |
Adjusting Marker Size
You can adjust marker size by using the scatter plot pop-up menu.
| Click on the button in the lower left corner of the scatter plot. |
Choose Marker Sizes:1. This assigns markers their minimum size.
![[menu]](images/mar_mareq2.gif)
Figure 10.7: Marker Sizes Menu
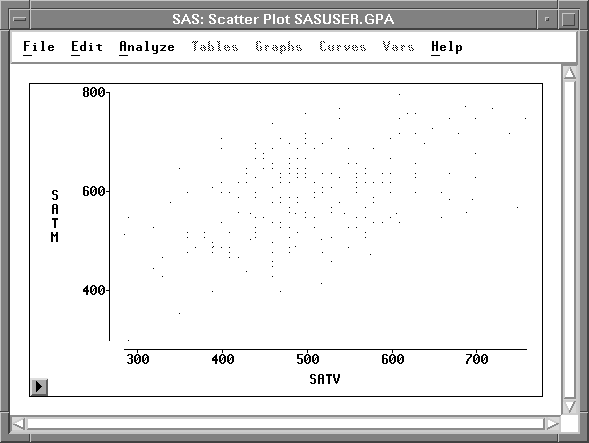
Figure 10.8: Markers at Minimum Size
| Choose Marker Sizes:8 from the pop-up menu. |
This assigns markers their maximum size.
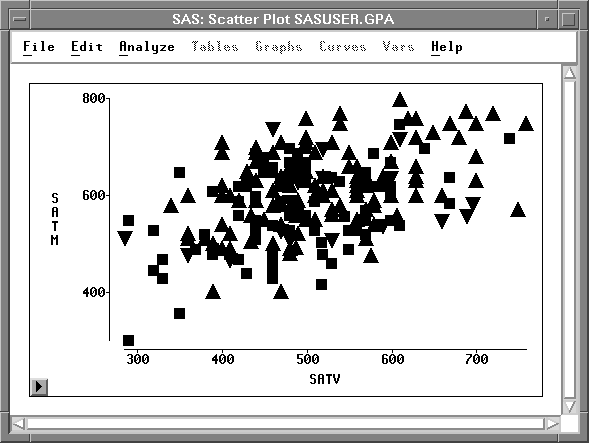
Figure 10.9: Markers at Maximum Size
| Choose Marker Sizes:Size to Fit from the pop-up menu. |
This assigns markers their default size.
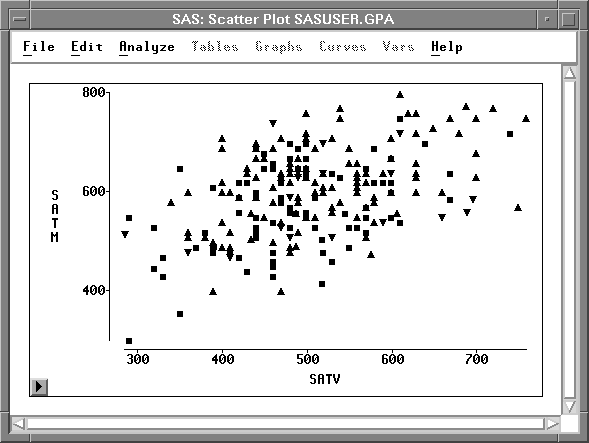
Figure 10.10: Default Marker Size
The default marker size is determined by the size of your graph, the resolution of your display, and the setting of the Marker Size option. You can set the Marker Size option as described in Chapter 29, "Configuring SAS/INSIGHT Software."
Note |
For large data sets, markers require plenty of memory. If your data set contains hundreds of observations and your host has insufficient memory, you can improve performance by using the default square marker for all observations. |
If you have a color display, it is often clearer to distinguish observations by color. Turn to the next chapter to see how to assign colors.
Copyright © 2007 by SAS Institute Inc., Cary, NC, USA. All rights reserved.