| Marking Observations |
Marking Observations
You can assign markers to use for displaying observations in box plots, scatter plots, and rotating plots. The markers appear with each observation in the data window. You can assign markers for observations you select, and you can let SAS/INSIGHT software assign markers automatically based on the value of a variable. You can control the size of the markers in any plot.
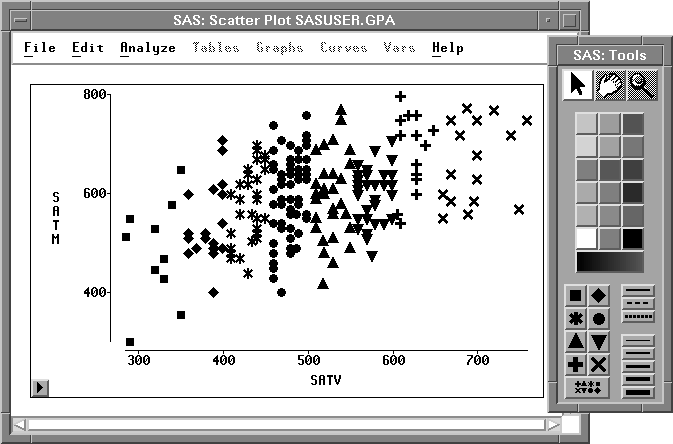
Figure 10.1: Marking Observations