| Marking Observations |
Marking by Interval Variable
You can also assign markers based on the value of an interval variable.
| Select GPA in the data window. |
| Click on the multiple markers button at the bottom of the markers window. |
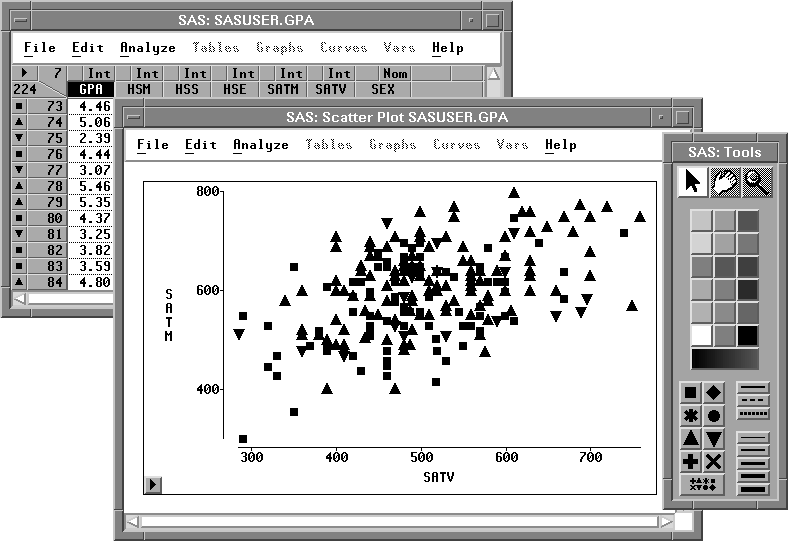
SAS/INSIGHT software assigns three markers to the observations depending on the value of GPA for that observation. Observations with values in the upper third of the range of GPA are assigned upward-pointing triangles. Observations with values in the middle third of the range of GPA are assigned squares. Observations with values in the lower third of the range of GPA are assigned downward-pointing triangles. These markers show a rough picture of the correlation between grade point average and SAT scores.

Figure 10.6: Assigning Markers by GPA
Copyright © 2007 by SAS Institute Inc., Cary, NC, USA. All rights reserved.