The RELIABILITY Procedure
- Overview
-
Getting Started
 Analysis of Right-Censored Data from a Single PopulationWeibull Analysis Comparing Groups of DataAnalysis of Accelerated Life Test DataWeibull Analysis of Interval Data with Common Inspection ScheduleLognormal Analysis with Arbitrary CensoringRegression ModelingRegression Model with Nonconstant ScaleRegression Model with Two Independent VariablesWeibull Probability Plot for Two Combined Failure ModesAnalysis of Recurrence Data on RepairsComparison of Two Samples of Repair DataAnalysis of Interval Age Recurrence DataAnalysis of Binomial DataThree-Parameter WeibullParametric Model for Recurrent Events DataParametric Model for Interval Recurrent Events Data
 -
SyntaxPrimary StatementsSecondary StatementsGraphical Enhancement StatementsPROC RELIABILITY StatementANALYZE StatementBY StatementCLASS StatementDISTRIBUTION StatementEFFECTPLOT StatementESTIMATE StatementFMODE StatementFREQ StatementINSET StatementLOGSCALE StatementLSMEANS StatementLSMESTIMATE StatementMAKE StatementMCFPLOT StatementMODEL StatementNENTER StatementNLOPTIONS StatementPROBPLOT StatementRELATIONPLOT StatementSLICE StatementSTORE StatementTEST StatementUNITID Statement
-
DetailsAbbreviations and NotationTypes of Lifetime DataProbability DistributionsProbability PlottingNonparametric Confidence Intervals for Cumulative Failure ProbabilitiesParameter Estimation and Confidence IntervalsRegression Model Statistics Computed for Each Observation for Lifetime DataRegression Model Statistics Computed for Each Observation for Recurrent Events DataRecurrence Data from Repairable SystemsODS Table NamesODS Graphics
- References
Parametric Model for Interval Recurrent Events Data
Byar (1980) provides data for recurrences of bladder tumors in patients in a clinical trial. Figure 17.52 is a partial listing of data for 86 patients, of which 48 were given a placebo and 38 were treated with the drug Thiotepa. The data are here grouped into one month intervals.
Figure 17.52: Partial Listing of the Bladder Tumor Data
| Obs | Group | Age | Age1 | N | R |
|---|---|---|---|---|---|
| 1 | Placebo | 0 | 1 | 48 | 0 |
| 2 | Placebo | 1 | 2 | 47 | 0 |
| 3 | Placebo | 2 | 3 | 46 | 1 |
| 4 | Placebo | 3 | 4 | 46 | 4 |
| 5 | Placebo | 4 | 5 | 46 | 7 |
| 6 | Placebo | 5 | 6 | 45 | 0 |
| 7 | Placebo | 6 | 7 | 45 | 2 |
| 8 | Placebo | 7 | 8 | 45 | 4 |
| 9 | Placebo | 8 | 9 | 44 | 1 |
| 10 | Placebo | 9 | 10 | 44 | 2 |
| 11 | Placebo | 10 | 11 | 44 | 4 |
| 12 | Placebo | 11 | 12 | 42 | 2 |
| 13 | Placebo | 12 | 13 | 42 | 1 |
| 14 | Placebo | 13 | 14 | 42 | 4 |
| 15 | Placebo | 14 | 15 | 42 | 1 |
| 16 | Placebo | 15 | 16 | 41 | 1 |
| 17 | Placebo | 16 | 17 | 41 | 5 |
| 18 | Placebo | 17 | 18 | 41 | 4 |
| 19 | Placebo | 18 | 19 | 41 | 4 |
| 20 | Placebo | 19 | 20 | 38 | 1 |
The following SAS statements fit a non-homogeneous Poisson process model with a power intensity function to the interval recurrence
data. Some patients were lost to follow-up in each month, so the number of patients observed changes from month to month.
The variable N provides the number of patients available at the beginning of each month and assumed to be observed throughout the month.
The variable R is the number of recurrences of tumors in each month. Age represents the number of months after randomization into the trial (starting with month 0), and Age1=Age+1 is the end of a month. The variable Group represents the treatment, either Placebo or Thiotepa. The MODEL statement requests a maximum likelihood fit of the model
with Group as a classification variable. The MCFPLOT statement requests a plot of the fitted model and nonparametric estimates of the
mean cumulative function for each group.
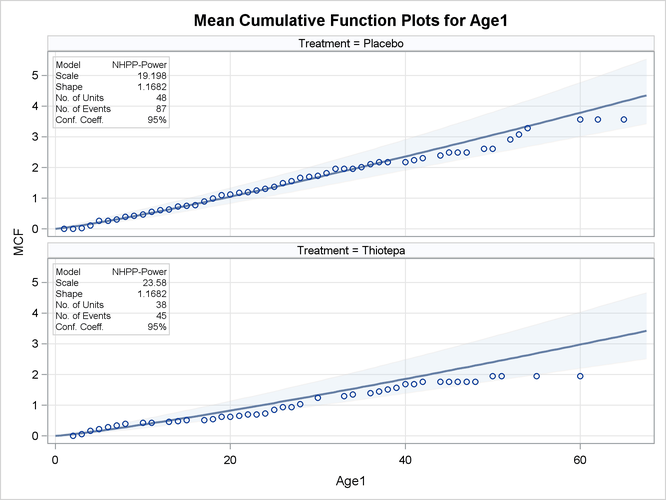
proc reliability data=Tumor;
   distribution nhpp(pow);
   freq R;
   nenter N;
   class Group;
   model  (Age Age1) = Group;
   mcfplot(Age Age1) = Group / fit=Model;
run;
The resulting maximum likelihood parameter estimates are shown in Figure 17.53.
Figure 17.53: Power Model Parameter Estimates for the Bladder Tumor Data
| NHPP-Power Parameter Estimates | |||||
|---|---|---|---|---|---|
| Parameter | Estimate | Standard Error |
Asymptotic Normal | ||
| 95% Confidence Limits | |||||
| Lower | Upper | ||||
| Intercept | 23.5802 | 3.1567 | 17.3932 | 29.7671 | |
| Group | Placebo | -4.3826 | 3.4873 | -11.2175 | 2.4523 |
| Group | Thiotepa | 0.0000 | 0.0000 | 0.0000 | 0.0000 |
| Shape | 1.1682 | 0.0960 | 0.9945 | 1.3723 | |
Nonparametric estimates of the mean cumulative function are plotted as points, and the fitted model is plotted as the solid line in Figure 17.54. Pointwise parametric confidence intervals are plotted by default when the fit=Model option is used.
Figure 17.54: Mean Cumulative Function Plot for the Bladder Tumor Data