The PARETO Procedure
- Overview
-
Getting Started

-
Syntax
-
Details
-
ExamplesCreating Before-and-After Pareto ChartsCreating Two-Way Comparative Pareto ChartsHighlighting the "Vital Few"Highlighting Combinations of CategoriesHighlighting Combinations of CellsOrdering Rows and Columns in a Comparative Pareto ChartMerging Columns in a Comparative Pareto ChartCreating Weighted Pareto ChartsCreating Alternative Pareto ChartsCustomizing Inset Labels and Formatting ValuesSpecifying Inset Headers and PositionsManaging a Large Number of Categories
- References
INSET Statement
-
INSET keyword-list </ options >;
The INSET statement enables you to enhance a Pareto chart by adding a box or table (called an inset) of summary statistics directly to the graph. An inset can display statistics that are calculated by the PARETO procedure or arbitrary values that are provided in a SAS data set.
An INSET statement must follow a chart statement, and it produces an inset on that chart. More than one INSET statement can apply to the same chart statement. When the chart statement produces a comparative chart, an associated INSET statement produces an inset in every cell of the chart. Statistics that are displayed in the inset of a cell are computed from the data that are associated with that cell.
Note: When ODS Graphics is enabled, only one INSET statement can be associated with a comparative Pareto chart. Insets are not available with legacy line printer charts, so the INSET statement is not applicable when you specify the LINEPRINTER option in the PROC PARETO statement.
The keyword-list can include any of the keywords listed in Table 15.4. Statistics are displayed in the order in which the keywords are specified. Each keyword-list entry has the following form:
keyword <='label'> <(format)>
By default, inset statistics are identified with appropriate labels, and numeric values are printed using appropriate formats. However, you can provide customized labels and formats. You provide a customized label by specifying the keyword for that statistic followed by an equal sign (=) and the label in quotation marks. Labels can have up to 24 characters. You provide the numeric format in parentheses after the keyword. If you specify both a label and a format for a statistic, the label must appear before the format. See Example 15.10.
Note the difference between keywords and options: keywords specify the information to be displayed in an inset, whereas options control the appearance of the inset. You can use options in the INSET statement to do the following:
-
specify the position of the inset
-
specify a header for the inset
-
specify enhancements for traditional graphics, such as background colors, text colors, text height, text font, and drop shadows
Table 15.5 lists available INSET statement options.
The following statements produce a vertical Pareto chart with insets in the upper left (northwest) and upper right (northeast) corners, and a horizontal comparative Pareto chart with insets in each cell.
proc pareto data=Failure3;
   vbar Cause / maxncat = 5 other = 'Others';
      inset nothercat / position = nw;
      inset nother / position = ne;
   hbar Cause / class = Stage;
      inset n;
run;
INSET Statement Keywords
Table 15.4 lists the keywords available in the INSET statement.
Table 15.4: INSET Statement Keywords
|
Keyword |
Description |
|---|---|
|
DATA=SAS-data-set |
Reads (label, value) pairs from a SAS data set |
|
N |
Specifies the sample size |
|
NEXCL |
Specifies the number of observations excluded from a restricted Pareto chart |
|
NOTHER |
Specifies the number of observations in the OTHER= category |
|
NOTHERCAT |
Specifies the number of categories merged to form the OTHER= category |
|
SUMWGTS |
Specifies the sum of weighted frequencies across all categories |
The NOTHERCAT and NOTHER statistics are 0 if the OTHER= option is not specified. The NEXCL statistic is 0 if the OTHER= option is specified.
All INSET keywords request a single statistic in an inset, except for the DATA= keyword. The DATA= keyword specifies a SAS
data set that contains (label, value) pairs to be displayed in an inset. The data set must contain the variables _LABEL_ (a character variable whose values provide labels for inset entries) and _VALUE_ (which can be character or numeric and provides values displayed in the inset). The label and value from each observation
in the DATA= data set occupy one line in the inset. Example 15.11 illustrates the use of the DATA= keyword.
INSET Statement Options
Figure 15.8 illustrates the terms that are used in this section.
Figure 15.8: Inset Terms
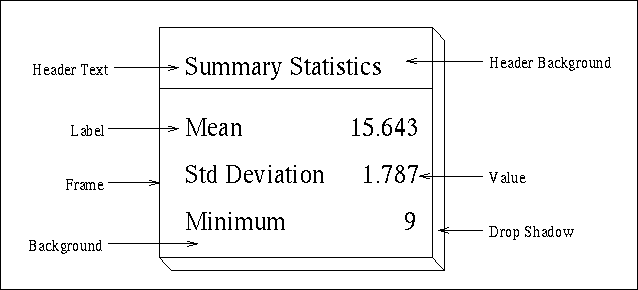
Table 15.5 lists the options available in the INSET statement.
Table 15.5: INSET Statement Options
|
Keyword |
Description |
|---|---|
|
General Options |
|
|
Specifies the format for numeric values in the inset |
|
|
Specifies the header text |
|
|
Suppresses the frame around the inset |
|
|
Specifies the position of the inset |
|
|
Options for ODS Graphics Output |
|
|
Specifies the color of the inset background |
|
|
Specifies the gutter width for an inset in the top or bottom margin |
|
|
Specifies the number of columns for an inset in the top or bottom margin |
|
|
Options for Traditional Graphics |
|
|
Specifies the color of the inset background |
|
|
Specifies the color of the header background |
|
|
Specifies the color of the frame |
|
|
Specifies the color of the header text |
|
|
Specifies the color of the drop shadow |
|
|
Specifies the color of the inset text |
|
|
Specifies that POSITION=(x,y) coordinates are in data units |
|
|
Specifies the text font |
|
|
Specifies the height of the inset text |
|
|
Specifies the reference point of an inset that is positioned by POSITION=(x,y) coordinates |
|
The following entries provide detailed descriptions of options in the INSET statement.
General Options
You can specify the following options when you use either ODS Graphics or traditional graphics:
ODS Graphics Options
You can specify the following options when you use ODS Graphics:
Traditional Graphics Options
You can specify the following options when you produce traditional graphics.