The PARETO Procedure
- Overview
-
Getting Started

-
Syntax
-
Details
-
ExamplesCreating Before-and-After Pareto ChartsCreating Two-Way Comparative Pareto ChartsHighlighting the "Vital Few"Highlighting Combinations of CategoriesHighlighting Combinations of CellsOrdering Rows and Columns in a Comparative Pareto ChartMerging Columns in a Comparative Pareto ChartCreating Weighted Pareto ChartsCreating Alternative Pareto ChartsCustomizing Inset Labels and Formatting ValuesSpecifying Inset Headers and PositionsManaging a Large Number of Categories
- References
Restricting the Number of Pareto Categories
Note: See Pareto Chart with Restricted Number of Categories in the SAS/QC Sample Library.
Unlike the previous examples, some applications involve too many categories to display on a chart. The solution presented here is to create a restricted Pareto chart that displays only the most frequently occurring categories.
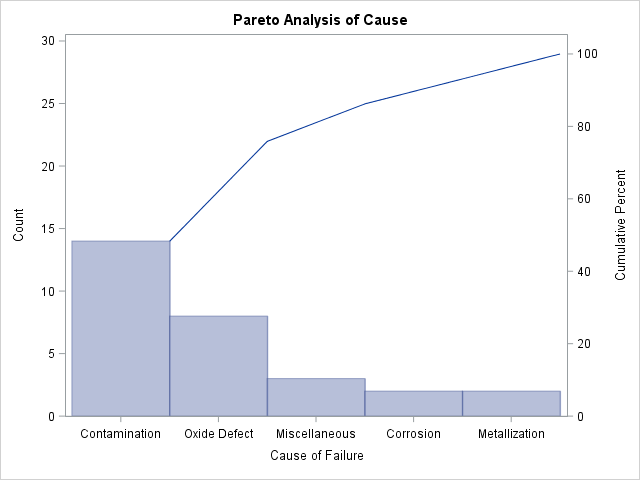
The following statements create a Pareto chart for the five most frequently occurring levels of Cause in the data set Failure2 (which is listed in Figure 15.3):
proc pareto data=Failure2;
   vbar Cause / freq    = Count
                scale   = count
                maxncat = 5;
run;
The MAXNCAT=
option specifies the number of categories to be displayed. The chart, shown in Figure 15.5, does not display the categories Doping and Silicon Defect.
Figure 15.5: Restricted Pareto Chart
You can also display the most frequently occurring categories and merge the remaining categories into a single other category that is represented by a bar. You can specify the name for the new category with the OTHER= option. If, in addition, you specify that name in the LAST= option, the category is positioned at the bottom of the chart. The following statements illustrate both options:
title 'Integrated Circuit Manufacturing Problems';
proc pareto data=Failure2;
   vbar Cause / freq     = Count
                scale    = count
                maxncat  = 5
                other    = 'Others'
                last     = 'Others'
                odstitle = title1;
run;
The chart is shown in Figure 15.6.
Figure 15.6: Restricted Pareto Chart with Other Category
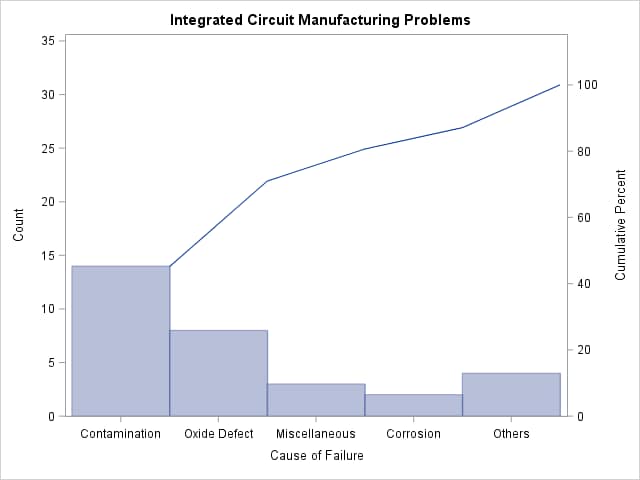
The number of categories displayed is five, which is the number specified in the MAXNCAT= option. The first four categories
are the four most frequently occurring problems in Failure2, and the fifth category merges the remaining problems.
Note that Corrosion and Metallization both have a frequency of two. When the MAXNCAT= option is applied to categories with tied frequencies, PROC PARETO breaks
the tie by using the order of the formatted values. Thus Corrosion is displayed, whereas Metallization is merged into the Other category. The MAXNCAT= and related options are described in the section Restricted Pareto Charts.