The RELIABILITY Procedure
- Overview
-
Getting Started
 Analysis of Right-Censored Data from a Single PopulationWeibull Analysis Comparing Groups of DataAnalysis of Accelerated Life Test DataWeibull Analysis of Interval Data with Common Inspection ScheduleLognormal Analysis with Arbitrary CensoringRegression ModelingRegression Model with Nonconstant ScaleRegression Model with Two Independent VariablesWeibull Probability Plot for Two Combined Failure ModesAnalysis of Recurrence Data on RepairsComparison of Two Samples of Repair DataAnalysis of Interval Age Recurrence DataAnalysis of Binomial DataThree-Parameter WeibullParametric Model for Recurrent Events DataParametric Model for Interval Recurrent Events Data
 -
SyntaxPrimary StatementsSecondary StatementsGraphical Enhancement StatementsPROC RELIABILITY StatementANALYZE StatementBY StatementCLASS StatementDISTRIBUTION StatementEFFECTPLOT StatementESTIMATE StatementFMODE StatementFREQ StatementINSET StatementLOGSCALE StatementLSMEANS StatementLSMESTIMATE StatementMAKE StatementMCFPLOT StatementMODEL StatementNENTER StatementNLOPTIONS StatementPROBPLOT StatementRELATIONPLOT StatementSLICE StatementSTORE StatementTEST StatementUNITID Statement
-
DetailsAbbreviations and NotationTypes of Lifetime DataProbability DistributionsProbability PlottingNonparametric Confidence Intervals for Cumulative Failure ProbabilitiesParameter Estimation and Confidence IntervalsRegression Model Statistics Computed for Each Observation for Lifetime DataRegression Model Statistics Computed for Each Observation for Recurrent Events DataRecurrence Data from Repairable SystemsODS Table NamesODS Graphics
- References
Analysis of Recurrence Data on Repairs
This example illustrates analysis of recurrence data from repairable systems. Repair data analysis differs from life data analysis, where units fail only once. As a repairable system ages, it accumulates repairs and costs of repairs. The RELIABILITY procedure provides a nonparametric estimate and plot of the mean cumulative function (MCF) for the number or cost of repairs for a population of repairable systems.
The nonparametric estimate of the MCF, the variance of the MCF estimate, and confidence limits for the MCF estimate are based
on the work of Nelson (1995). The MCF, also written as ![]() , is defined by Nelson (1995) to be the population mean of the distribution of the cumulative number or cost of repairs at age t. The method does not assume any underlying structure for the repair process.
, is defined by Nelson (1995) to be the population mean of the distribution of the cumulative number or cost of repairs at age t. The method does not assume any underlying structure for the repair process.
The SAS statements that follow create the listing of the SAS data set VALVE shown in Figure 16.31, which contains repair histories of 41 diesel engines in a fleet (Nelson, 1995). The valve seats in these engines wear out and must be replaced. The variable Id is a unique identifier for individual engines. The variable Days provides the engine age in days. The value of the variable Value is 1 if the age is a valve seat replacement age or -1 if the age is the end of history, or censoring age, for the engine.
data valve;
   input id Days value @@;
   label Days = 'Time of Replacement (Days)';
   datalines;
251 761 -1      252 759 -1      327  98  1      327 667 -1
328 326  1      328 653  1      328 653  1      328 667 -1
329 665 -1      330  84  1      330 667 -1      331  87  1
331 663 -1      389 646  1      389 653 -1      390  92  1
390 653 -1      391 651 -1      392 258  1      392 328  1
392 377  1      392 621  1      392 650 -1      393  61  1
393 539  1      393 648 -1      394 254  1      394 276  1
394 298  1      394 640  1      394 644 -1      395  76  1
395 538  1      395 642 -1      396 635  1      396 641 -1
397 349  1      397 404  1      397 561  1      397 649 -1
398 631 -1      399 596 -1      400 120  1      400 479  1
400 614 -1      401 323  1      401 449  1      401 582 -1
402 139  1      402 139  1      402 589 -1      403 593 -1
404 573  1      404 589 -1      405 165  1      405 408  1
405 604  1      405 606 -1      406 249  1      406 594 -1
407 344  1      407 497  1      407 613 -1      408 265  1
408 586  1      408 595 -1      409 166  1      409 206  1
409 348  1      409 389 -1      410 601 -1      411 410  1
411 581  1      411 601 -1      412 611 -1      413 608 -1
414 587 -1      415 367  1      415 603 -1      416 202  1
416 563  1      416 570  1      416 585 -1      417 587 -1
418 578 -1      419 578 -1      420 586 -1      421 585 -1
422 582 -1
;
Figure 16.31: Partial Listing of the Valve Seat Data
| Obs | id | Days | value |
|---|---|---|---|
| 1 | 251 | 761 | -1 |
| 2 | 252 | 759 | -1 |
| 3 | 327 | 98 | 1 |
| 4 | 327 | 667 | -1 |
| 5 | 328 | 326 | 1 |
| 6 | 328 | 653 | 1 |
| 7 | 328 | 653 | 1 |
| 8 | 328 | 667 | -1 |
| 9 | 329 | 665 | -1 |
| 10 | 330 | 84 | 1 |
| 11 | 330 | 667 | -1 |
| 12 | 331 | 87 | 1 |
| 13 | 331 | 663 | -1 |
| 14 | 389 | 646 | 1 |
| 15 | 389 | 653 | -1 |
| 16 | 390 | 92 | 1 |
| 17 | 390 | 653 | -1 |
| 18 | 391 | 651 | -1 |
| 19 | 392 | 258 | 1 |
| 20 | 392 | 328 | 1 |
The following statements produce the graphical display in Figure 16.32.
proc reliability;
   unitid id;
   mcfplot Days*value(-1) / nocenprint;
run;
The UNITID statement specifies that the variable Id uniquely identifies each system. The MCFPLOT statement requests a plot of the MCF estimates as a function of the age variable
Days, and it specifies -1 as the value of the variable Value, which identifies the end of history for each engine (system). The option NOCENPRINT specifies that only failure times, and
not censoring times, be printed in the tabular output.
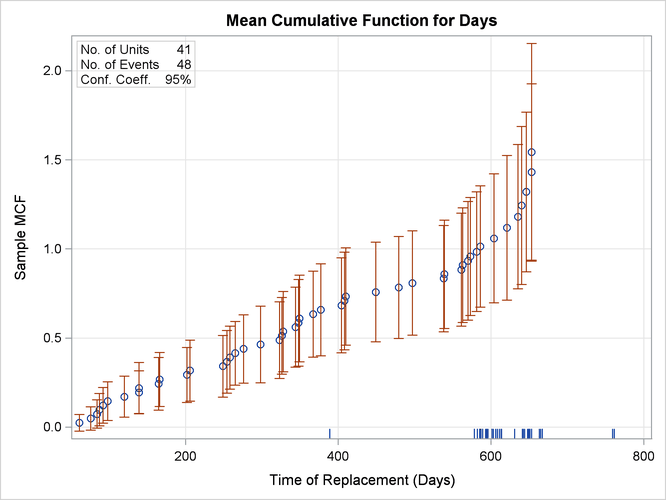
In Figure 16.32, the MCF estimates and confidence limits are plotted versus system age in days. The end-of-history ages are plotted in an area at the top of the plot. Except for the last few points, the plot is essentially a straight line, suggesting a constant replacement rate. Consequently, the prediction of future replacements of valve seats can be based on a fitted line in this case.
Figure 16.32: Mean Cumulative Function for the Number of Repairs
A partial listing of the tabular output is shown in Figure 16.33 and Figure 16.34. It contains a summary of the repair data, estimates of the MCF, the Nelson (1995) standard errors, and confidence intervals for the MCF.
Figure 16.33: Partial Listing of the Output for the Valve Seat Data
| Recurrence Data Summary | |
|---|---|
| Input Data Set | WORK.VALVE |
| Observations Used | 89 |
| Number of Units | 41 |
| Number of Events | 48 |
Figure 16.34: Partial Listing of the Output for the Valve Seat Data
| Recurrence Data Analysis | |||||
|---|---|---|---|---|---|
| Age | Sample MCF | Standard Error | 95% Confidence Limits | Unit ID | |
| Lower | Upper | ||||
| 61.00 | 0.024 | 0.024 | -0.023 | 0.072 | 393 |
| 76.00 | 0.049 | 0.034 | -0.017 | 0.115 | 395 |
| 84.00 | 0.073 | 0.041 | -0.007 | 0.153 | 330 |
| 87.00 | 0.098 | 0.046 | 0.007 | 0.188 | 331 |
| 92.00 | 0.122 | 0.051 | 0.022 | 0.222 | 390 |
| 98.00 | 0.146 | 0.055 | 0.038 | 0.255 | 327 |
| 120.00 | 0.171 | 0.059 | 0.056 | 0.286 | 400 |
| 139.00 | 0.195 | 0.062 | 0.074 | 0.316 | 402 |
| 139.00 | 0.220 | 0.073 | 0.076 | 0.363 | 402 |
| 165.00 | 0.244 | 0.075 | 0.096 | 0.392 | 405 |
| 166.00 | 0.268 | 0.077 | 0.117 | 0.420 | 409 |
| 202.00 | 0.293 | 0.079 | 0.138 | 0.447 | 416 |
| 206.00 | 0.317 | 0.088 | 0.146 | 0.489 | 409 |
| 249.00 | 0.341 | 0.089 | 0.168 | 0.515 | 406 |
| 254.00 | 0.366 | 0.090 | 0.190 | 0.542 | 394 |
| 258.00 | 0.390 | 0.090 | 0.213 | 0.568 | 392 |
| 265.00 | 0.415 | 0.091 | 0.236 | 0.593 | 408 |
| 276.00 | 0.439 | 0.098 | 0.247 | 0.631 | 394 |
| 298.00 | 0.463 | 0.110 | 0.249 | 0.678 | 394 |
| 323.00 | 0.488 | 0.110 | 0.273 | 0.703 | 401 |
| 326.00 | 0.512 | 0.110 | 0.297 | 0.727 | 328 |
| 328.00 | 0.537 | 0.115 | 0.311 | 0.762 | 392 |
| 344.00 | 0.561 | 0.115 | 0.336 | 0.786 | 407 |
| 348.00 | 0.585 | 0.124 | 0.342 | 0.829 | 409 |
| 349.00 | 0.610 | 0.124 | 0.367 | 0.852 | 397 |
| 367.00 | 0.634 | 0.123 | 0.393 | 0.876 | 415 |
| 377.00 | 0.659 | 0.132 | 0.400 | 0.917 | 392 |
| 404.00 | 0.684 | 0.136 | 0.417 | 0.950 | 397 |
| 408.00 | 0.709 | 0.140 | 0.435 | 0.983 | 405 |
| 410.00 | 0.734 | 0.139 | 0.461 | 1.006 | 411 |
| 449.00 | 0.759 | 0.143 | 0.479 | 1.038 | 401 |
| 479.00 | 0.784 | 0.146 | 0.497 | 1.070 | 400 |
| 497.00 | 0.809 | 0.149 | 0.516 | 1.101 | 407 |
| 538.00 | 0.834 | 0.152 | 0.535 | 1.132 | 395 |
| 539.00 | 0.859 | 0.155 | 0.554 | 1.163 | 393 |
| 561.00 | 0.884 | 0.162 | 0.567 | 1.201 | 397 |
| 563.00 | 0.909 | 0.164 | 0.587 | 1.230 | 416 |
| 570.00 | 0.934 | 0.170 | 0.600 | 1.267 | 416 |
| 573.00 | 0.959 | 0.169 | 0.627 | 1.290 | 404 |
| 581.00 | 0.985 | 0.171 | 0.649 | 1.320 | 411 |
| 586.00 | 1.014 | 0.174 | 0.674 | 1.355 | 408 |
| 604.00 | 1.060 | 0.185 | 0.697 | 1.422 | 405 |
| 621.00 | 1.119 | 0.208 | 0.712 | 1.525 | 392 |
| 635.00 | 1.181 | 0.207 | 0.776 | 1.587 | 396 |
| 640.00 | 1.244 | 0.226 | 0.800 | 1.687 | 394 |
| 646.00 | 1.320 | 0.229 | 0.873 | 1.768 | 389 |
| 653.00 | 1.432 | 0.252 | 0.937 | 1.926 | 328 |
| 653.00 | 1.543 | 0.312 | 0.932 | 2.154 | 328 |
Parametric modeling of the repair process requires more assumptions than nonparametric modeling, and considerable work has been done in this area. Ascher and Feingold (1984), Tobias and Trindade (1995), Crowder et al. (1991), Meeker and Escobar (1998), Cook and Lawless (2007), Abernethy (2006), and Rigdon and Basu (2000) describe parametric models for repair processes. Repairs are sometimes modeled as a nonhomogeneous Poisson process, and the RELIABILITY procedure provides several forms of Poisson process models for recurrent events data. See the section Parametric Models for Recurrent Events Data for details about the Poisson process models that the RELIABILITY procedure provides.
A nonparametric MCF plot might be a first step in modeling a repair process, and, in many cases, provide the required answers without further analysis. An estimate of the MCF for a sample of systems aids engineers in determining the repair rate at any age and the increase or decrease of repair rate with population age. The estimate is also useful for predicting the number of future repairs.