XCHART Statement: CUSUM Procedure
- Overview
-
Getting Started

-
Syntax
-
DetailsBasic Notation for Cusum ChartsFormulas for Cumulative SumsDefining the Decision Interval for a One-Sided Cusum SchemeDefining the V-Mask for a Two-Sided Cusum SchemeDesigning a Cusum SchemeCusum Charts Compared with Shewhart ChartsMethods for Estimating the Standard DeviationOutput Data SetsODS TablesODS GraphicsInput Data SetsMissing Values
-
Examples
Example 6.3 Combined Shewhart–Cusum Scheme
Lucas and Crosier (1982) See CUSCOMB in the SAS/QC Sample Libraryintroduced a combined Shewhart-cusum scheme that is illustrated in this example. Also refer to Ryan (1989). The data set used here is Cans, which is created in Creating a One-Sided Cusum Chart with a Decision Interval.
The first step is to compute and save one-sided cusums to detect a positive shift from the mean.
proc cusum data=Cans;
   xchart Weight*Hour /
      nochart
      mu0    = 8.100     /* target mean for process  */
      sigma0 = 0.050     /* known standard deviation */
      delta  = 1         /* shift to be detected     */
      h      = 3         /* cusum parameter h        */
      k      = 0.5       /* cusum parameter k        */
      scheme = onesided
      outtable = Tabcus
         ( drop   = _var_ _subn_ _exlim_
           rename = ( _cusum_ = _subr_ _h_ = _uclr_ ) )
      ;
run;
Note that a headstart value is not used here but can be specified with the HSTART= option. Several variables in the OUTTABLE= data set are dropped or renamed so that they can later be read by the SHEWHART procedure.
The next step is to construct a Shewhart chart (not shown) for individual measurements.
proc shewhart data=Cans;
   irchart Weight*Hour /
      nochart
      mu0      = 8.100
      sigma0   = 0.050
      outtable = Tabx
         ( drop   = _subr_  _lclr_ _r_ _uclr_ );
   id comment;
run;
By default, ![]() limits are computed, but the multiple of
limits are computed, but the multiple of ![]() can be modified with the SIGMAS= option. As before, the results are saved in an OUTTABLE= data set.
can be modified with the SIGMAS= option. As before, the results are saved in an OUTTABLE= data set.
Next, the two OUTTABLE= data sets are merged.
data Combine;
   merge Tabx Tabcus; by Hour;
   _lclr_ = 0.0;
   _r_    = 0.5 * _uclr_;
run;
The data set Combine has the structure required for a TABLE= data set used with the IRCHART statement in the SHEWHART procedure (see the section
TABLE= Data Set).
Finally, the combined scheme is displayed with the SHEWHART procedure.
title "Combined Shewhart-Cusum Analysis for Weight";
proc shewhart table=Combine;
   irchart Weight*Hour /
      ypct1     = 50
      noctl2
      ucllabel2 = 'h=0.3'
      outlabel  = ( comment )
      outlabel2 = ( comment )
      split     = '/';
   label _subi_ = 'Shewhart/Cusum';
run;
The chart is shown in Output 6.3.1.
Output 6.3.1: Combined Shewhart–Cusum Scheme
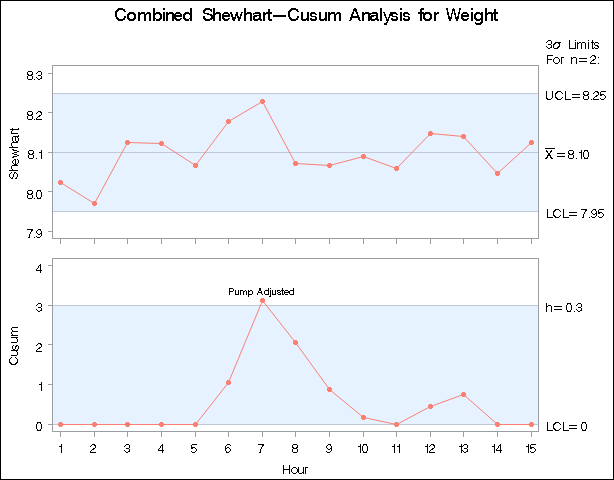
Note that a shift is detected by the cusum scheme but not by the Shewhart chart. The point exceeding the decision interval
is labeled with the variable comment created in the data set Cans.
Lucas and Crosier (1982) tabulates average run lengths for combined Shewhart-cusum schemes. The scheme used here has an ARL of 111.1 for ![]() and an ARL of 6.322 for
and an ARL of 6.322 for ![]() .
.