XCHART Statement: CUSUM Procedure
- Overview
-
Getting Started

-
Syntax
-
DetailsBasic Notation for Cusum ChartsFormulas for Cumulative SumsDefining the Decision Interval for a One-Sided Cusum SchemeDefining the V-Mask for a Two-Sided Cusum SchemeDesigning a Cusum SchemeCusum Charts Compared with Shewhart ChartsMethods for Estimating the Standard DeviationOutput Data SetsODS TablesODS GraphicsInput Data SetsMissing Values
-
Examples
Defining the Decision Interval for a One-Sided Cusum Scheme
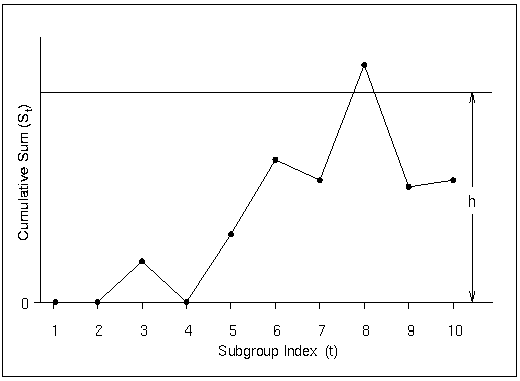
The height of the decision interval is h, expressed as a multiple of the standard error of the subgroup mean. You can specify h with the H= option in the XCHART statement or with the variable _H_ in a LIMITS= data set. The decision interval is displayed as a horizontal line on the cusum chart, as illustrated in Figure 6.13.
Figure 6.13: Decision Interval