| The ANOM Procedure |
Uses of Analysis of Means
Many statistical quality improvement applications involve a comparison of treatment means to determine which are significantly different from the overall average. For example, a manufacturing engineer might run an experiment to investigate which of six positions on a machine are producing different output, in the sense that the average measurement for each position differs from the overall average. Likewise, a health care system administrator might ask which clinics in the system have a higher or lower rate of admissions than the average for all clinics.
Questions of this type can be answered with analysis of means, which is an alternative to one-way analysis of variance (ANOVA) for a fixed effects model. However, unlike ANOVA, which simply determines whether there is a statistically significant difference in the treatment means, ANOM identifies the means that are significantly different from the overall mean. As a statistical technique, ANOM is a method for making multiple comparisons that is sometimes referred to as a "multiple comparison with the weighted mean." Analysis of means lends itself to quality improvement applications because it has a simple graphical representation that is similar to a Shewhart chart and requires little training to interpret. This representation is also useful for assessing practical significance.
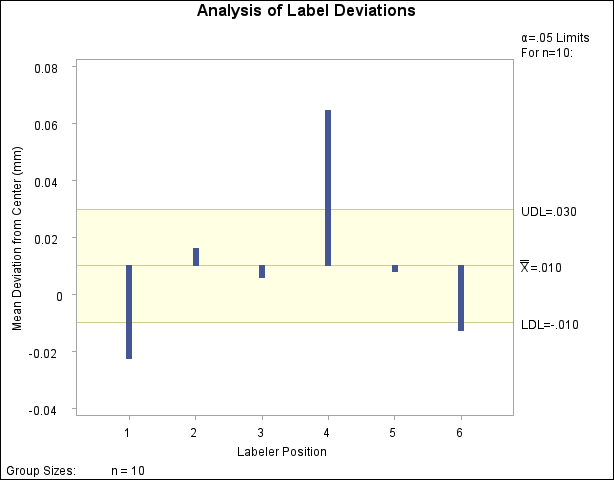
Figure 4.1 illustrates a typical ANOM chart. The central line represents the overall average. The treatment means, plotted as deviations from the overall average are compared with upper and lower decision limits to identify which are significantly different from the overall mean (in this case, the means corresponding to the first, fourth, and sixth positions).

Although the term "analysis of means" suggests that the method is intended for means of continuous response measurements, the method is also applicable to means of attributes data, including proportions and rates.
Analysis of means was introduced as a tool for statistical quality control by Ellis Ott in 1967, and it became popular during the early 1980s, when it was applied to experimental data in manufacturing. In this setting, measurements are taken at a number of treatment levels (factor levels). During the 1990s, the use of ANOM spread to service industry applications and, in particular, health care quality improvement. In these settings, data (such as utilization rates) are observed for a number of groups (such as hospitals or clinics).
Copyright © SAS Institute, Inc. All Rights Reserved.