TIMEPLOT Procedure

Example 3: Using a Variable for a Plotting Symbol
| Features: |
ID statement
|
| Data set: | SALES |
| Format: | MONTHFMT. |
Program
libname proclib
'SAS-library';
options formchar="|----|+|---+=|-/\<>*" fmtsearch=(proclib);
proc timeplot data=sales;
   plot stove=seller /
npp
ref=1500 refchar=':'
joinref
axis=100 to 3000 by 50;
id month week;
format month monthfmt.;
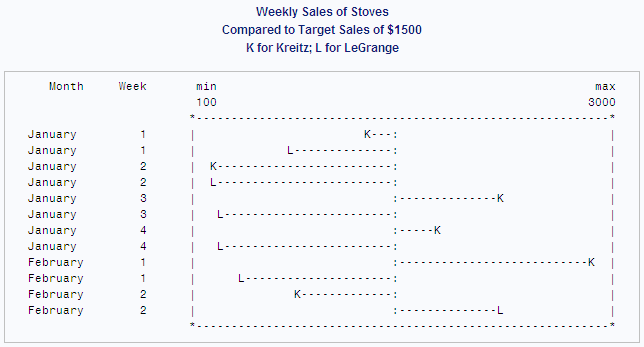
   title 'Weekly Sales of Stoves';
   title2 'Compared to Target Sales of $1500';
   title3 'K for Kreitz; L for LeGrange';
run;
Program Description
Set the SAS system options.Setting FORMCHAR to this exact string renders better HTML output
when it is viewed outside of the SAS environment where SAS Monospace
fonts are not available. FMTSEARCH= adds the SAS library PROCLIB
to the search path that is used to locate formats.
Plot sales of stoves. The
PLOT statement specifies both the plotting variable, Stove, and a
symbol variable, Seller. The plotting symbol is the first letter of
the formatted value of the Seller (in this case, L or K).
Suppress the appearance of the plotting variable in the
listing. The values of the Stove variable
will not appear in the listing.
Create a reference line on the plot. REF= and REFCHAR= draw a line of colons at the sales
target of $1500.
Draw a line between the symbols on each line of the plot. In this plot, JOINREF connects each plotting symbol
to the reference line.
Customize the horizontal axis. AXIS= sets the minimum value of the horizontal axis to 100 and the
maximum value to 3000. BY 50 specifies that each print position on
the axis represents 50 units (in this case, dollars).
Label the rows in the listing. The values of the ID variables, Month and Week, are used to identify
each row of the listing.