TIMEPLOT Procedure

Example 4: Superimposing Two Plots
| Features: |
PROC TIMEPLOT statement options: : MAXDEC=
|
| Data set: | SALES |
Program
options formchar="|----|+|---+=|-/\<>*";
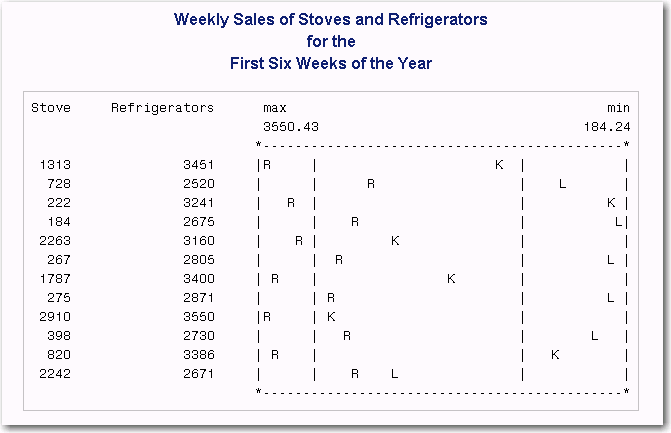
proc timeplot data=sales maxdec=0;
plot stove=seller icebox='R' /
overlay
ref=mean(stove icebox)
reverse;
label icebox='Refrigerators';
   title 'Weekly Sales of Stoves and Refrigerators';
   title2 'for the';
   title3 'First Six Weeks of the Year';
run;
Program Description
Set the FORMCHAR option.Setting FORMCHAR to this exact string renders better HTML output
when it is viewed outside of the SAS environment where SAS Monospace
fonts are not available.
Specify the number of decimal places to display. MAXDEC= specifies the number of decimal places to
display in the listing.
Plot sales of both stoves and refrigerators.The PLOT statement requests two plots. One plot uses
the first letter of the formatted value of Seller to plot the values
of Stove. The other uses the letter R (to match the label Refrigerators) to plot the value of Icebox.
Create two reference lines on the plot. REF= draws two reference lines: one perpendicular
to the mean of Stove, the other perpendicular to the mean of Icebox.