TIMEPLOT Procedure

Example 1: Plotting a Single Variable
| Features: |
ID statement
|
Program
options formchar="|----|+|---+=|-/\<>*";
data sales;
   input Month Week Seller $ Icebox Stove;
   datalines;
1 1 Kreitz   3450.94 1312.61
1 1 LeGrange 2520.04  728.13
1 2 Kreitz   3240.67  222.35
1 2 LeGrange 2675.42  184.24
1 3 Kreitz   3160.45 2263.33
1 3 LeGrange 2805.35  267.35
1 4 Kreitz   3400.24 1787.45
1 4 LeGrange 2870.61  274.51
2 1 Kreitz   3550.43 2910.37
2 1 LeGrange 2730.09  397.98
2 2 Kreitz   3385.74  819.69
2 2 LeGrange 2670.93 2242.24
;
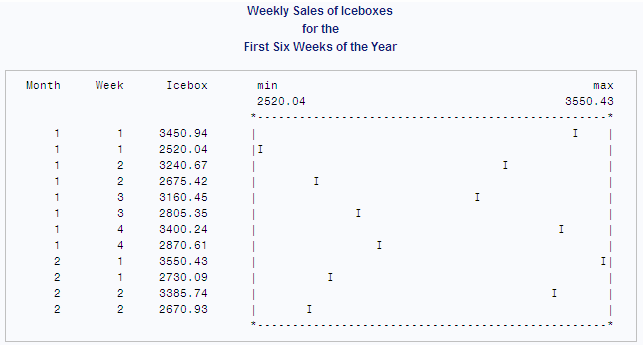
proc timeplot data=sales;
   plot icebox / pos=50;
id month week;
   title 'Weekly Sales of Iceboxes';
   title2 'for the';
   title3 'First Six Weeks of the Year';
run;
Program Description
Set the FORMCHAR option.Setting FORMCHAR to this exact string renders better HTML output
when it is viewed outside of the SAS environment where SAS Monospace
fonts are not available.
Create the SALES data set. SALES contains weekly information about the sales of refrigerators
and stoves by two sales representatives.
data sales;
   input Month Week Seller $ Icebox Stove;
   datalines;
1 1 Kreitz   3450.94 1312.61
1 1 LeGrange 2520.04  728.13
1 2 Kreitz   3240.67  222.35
1 2 LeGrange 2675.42  184.24
1 3 Kreitz   3160.45 2263.33
1 3 LeGrange 2805.35  267.35
1 4 Kreitz   3400.24 1787.45
1 4 LeGrange 2870.61  274.51
2 1 Kreitz   3550.43 2910.37
2 1 LeGrange 2730.09  397.98
2 2 Kreitz   3385.74  819.69
2 2 LeGrange 2670.93 2242.24
;
Plot sales of refrigerators. The plot variable, Icebox, appears in both the listing and the output.
POS= provides 50 print positions for the horizontal axis.