TIMEPLOT Procedure

Example 5: Showing Multiple Observations on One Line of a Plot
| Features: |
CLASS statement
|
| Data set: | SALES |
| Format: | MONTHFMT. |
Program
libname proclib
'SAS-library';
options formchar="|----|+|---+=|-/\<>*" fmtsearch=(proclib);
proc timeplot data=sales;
   class month week;
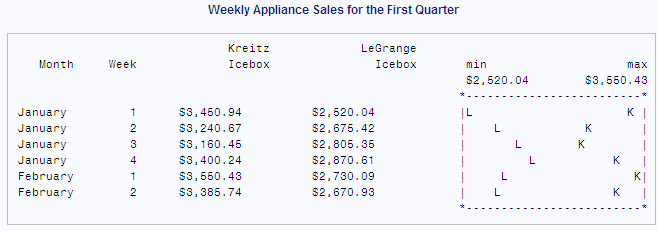
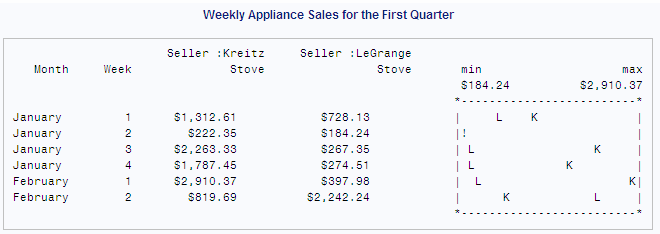
   plot stove=seller  / pos=25 ovpchar='!';
   plot icebox=seller / pos=25 ovpchar='!' nosymname;
format stove icebox dollar10.2 month monthfmt.;
   title 'Weekly Appliance Sales for the First Quarter';
run;
Program Description
Set the SAS system options.Setting FORMCHAR to this exact string renders better HTML output
when it is viewed outside of the SAS environment where SAS Monospace
fonts are not available. FMTSEARCH= adds the SAS library PROCLIB
to the search path that is used to locate formats.
Specify subgroups for the analysis. The CLASS statement groups all observations with
the same values of Month and Week into one line in the output. Using
the CLASS statement with a symbol variable produces in the listing
one column of the plot variable for each value of the symbol variable.
Plot sales of stoves and refrigerators. Each PLOT statement produces a separate plot. The
plotting symbol is the first character of the formatted value of the
symbol variable: K for
Kreitz; L for LeGrange.
POS= specifies that each plot uses 25 print positions for the horizontal
axis. OVPCHAR= designates the exclamation point as the plotting symbol
when the plotting symbols coincide. NOSYMNAME suppresses the name
of the symbol variable Seller from the second listing.