TABULATE Procedure
- Syntax

- Overview
- Concepts
- Using
- Results
- Examples Creating a Basic Two-Dimensional TableSpecifying Class Variable Combinations to Appear in a TableUsing Preloaded Formats with Class VariablesUsing Multilabel FormatsCustomizing Row and Column HeadingsSummarizing Information with the Universal Class Variable ALLEliminating Row HeadingsIndenting Row Headings and Eliminating Horizontal SeparatorsCreating Multipage TablesReporting on Multiple-Response Survey DataReporting on Multiple-Choice Survey DataCalculating Various Percentage StatisticsUsing Denominator Definitions to Display Basic Frequency Counts and PercentagesSpecifying Style Elements for ODS OutputStyle PrecedenceNOCELLMERGE Option
- References
Concepts: TABULATE Procedure
Terminology: TABULATE Procedure
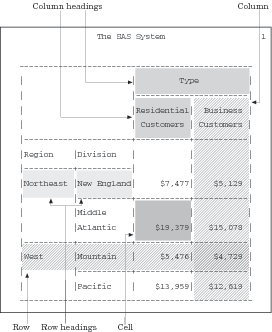
The following figures illustrate some of the terms that
are commonly used in discussions of PROC TABULATE.
In addition, the following
terms frequently appear in discussions of PROC TABULATE:
the combination of
unique values of class variables. The TABULATE procedure creates a
separate category for each unique combination of values that exists
in the observations of the data set. Each category that is created
by PROC TABULATE is represented by one or more cells in the table
where the pages, rows, and columns that describe the category intersect.
The table in Parts of a PROC TABULATE Table contains three
class variables: Region, Division, and Type. These
class variables form the eight categories listed in the following
table. (For convenience, the categories are described in terms of
their formatted values.)
a variable whose values
appear in the table with each value of another variable.
In Parts of a PROC TABULATE Table, Division is
nested under Region.
the text that appears
above the table if the table has a page dimension. However, if you
specify BOX=_PAGE_ in the TABLE statement, then the text that would
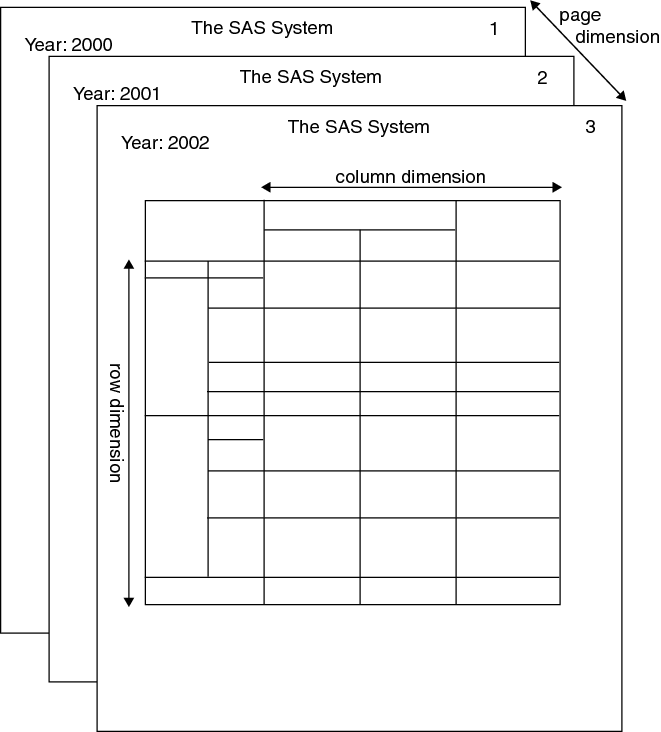
appear above the table appears in the box. In PROC TABULATE Table Dimensions, the word
Year:,
followed by the value, is the page dimension text.Page dimension text
has a style. The default style is Beforecaption. For more information
about using styles, see Introduction to the Output Delivery System in SAS Output Delivery System: User's Guide.
the group of cells
that is produced by crossing a single element from each dimension
of the TABLE statement when one or more dimensions contain concatenated
elements.
Parts of a PROC TABULATE Table contains no subtables. For an illustration
of a table that consists of multiple subtables, see Using Denominator Definitions to Display Basic Frequency Counts and Percentages.
Statistics That Are Available in PROC TABULATE
Use the following keywords
to request statistics in the TABLE statement or to specify statistic
keywords in the KEYWORD or KEYLABEL statement.
Note: If a variable name (class
or analysis) and a statistic name are the same, then enclose the statistic
name in single quotation marks (for example,
'MAX').
These statistics, the
formulas that are used to calculate them, and their data requirements
are discussed in the Keywords and Formulas section of this document.
Formatting Class Variables
Use the FORMAT statement to assign a format to a class
variable for the duration of a PROC TABULATE step. When you assign
a format to a class variable, PROC TABULATE uses the formatted values
to create categories, and it uses the formatted values in headings.
If you do not specify a format for a class variable, and the variable
does not have any other format assigned to it, then the default format,
BEST12., is used, unless the GROUPINTERNAL option is specified.
User-defined formats
are particularly useful for grouping values into fewer categories.
For example, if you have a class variable, Age, with values ranging
from 1 to 99, then you could create a user-defined format that groups
the ages so that your tables contain a manageable number of categories.
The following PROC FORMAT step creates a format that condenses all
possible values of age into six groups of values.
proc format;
   value agefmt  0-29='Under 30'
                30-39='30-39'
                40-49='40-49'
                50-59='50-59'
                60-69='60-69'
                other='70 or over';
run;
For information about
creating user-defined formats, see FORMAT Procedure.
By default, PROC TABULATE
includes in a table only those formats for which the frequency count
is not zero and for which values are not missing. To include missing
values for all class variables in the output, use the MISSING option
in the PROC TABULATE statement, and to include missing values for
selected class variables, use the MISSING option in a CLASS statement.
To include formats for which the frequency count is zero, use the
PRELOADFMT option in a CLASS statement and the PRINTMISS option in
the TABLE statement, or use the CLASSDATA= option in the PROC TABULATE
statement.
Formatting Values in Tables
The
formats for data in table cells serve two purposes. They determine
how PROC TABULATE displays the values, and they determine the width
of the columns. The default format for values in table cells is 12.2.
You can modify the format for printing values in table cells by doing
the following:
PROC TABULATE determines
the format to use for a particular cell from the following default
order of precedence for formats:
-
If no other formats are specified, then PROC TABULATE uses the default format (12.2).
-
The FORMAT= option in the PROC TABULATE statement changes the default format. If no format modifiers affect a cell, then PROC TABULATE uses this format for the value in that cell.
-
A format modifier in the page dimension applies to the values in all the table cells on the logical page unless you specify another format modifier for a cell in the row or column dimension.
-
A format modifier in the row dimension applies to the values in all the table cells in the row unless you specify another format modifier for a cell in the column dimension.
-
A format modifier in the column dimension applies to the values in all the table cells in the column.
You can change this
order of precedence by using the FORMAT_PRECEDENCE= option in the
TABLE statement. See TABLE Statement for more information. For example, if you specify FORMAT_PRECEDENCE=ROW and specify
a format modifier in the row dimension, then that format overrides
all other specified formats for the table cells.
How Using BY-Group Processing Differs from Using the Page Dimension
Using
the page-dimension expression in a TABLE statement can have an effect
similar to using a BY statement.
Contrasting the BY Statement and the Page Dimension
|
The observations in
the input data set must be sorted by the BY variables. (footnote1)
|
|||
|
Use ALL in the page
dimension to create a report for all classes. (See Summarizing Information with the Universal Class Variable ALL.)
|
|||
|
The percentages in the
tables are percentages of the total for that BY group. You cannot
calculate percentages for a BY group compared to the totals for all
BY groups because PROC TABULATE prepares the individual reports separately.
Data for the report for one BY group are not available to the report
for another BY group.
|
You can use denominator
definitions to control the meaning of PCTN. (See Calculating Percentages .)
|
||
|
You can use the #BYVAL,
#BYVAR, and #BYLINE specifications in TITLE statements to customize
the titles for each BY group. (See Creating Titles That Contain BY-Group Information .)
|
|||
Calculating Percentages
Calculating the Percentage of the Value in a Single Table Cell
The following statistics
print the percentage of the value in a single table cell in relation
to the total of the values in a group of cells. No denominator definitions
are required. However, an analysis variable can be used as a denominator
definition for percentage sum statistics.
These statistics calculate
the most commonly used percentages. See Calculating Various Percentage Statistics for an example.
Using PCTN and PCTSUM
PCTN and
PCTSUM statistics can be used to calculate these same percentages.
They enable you to manually define denominators. PCTN and PCTSUM statistics
print the percentage of the value in a single table cell in relation
to the value (used in the denominator of the calculation of the percentage)
in another table cell or to the total of the values in a group of
cells. By default, PROC TABULATE summarizes the values in all N cells
(for PCTN) or all SUM cells (for PCTSUM) and uses the summarized value
for the denominator. You can control the value that PROC TABULATE
uses for the denominator with a denominator definition.
You place a denominator
definition in angle brackets (< and >) next to the PCTN or PCTSUM
statistic. The denominator definition specifies which categories to
sum for the denominator.
This section illustrates
how to specify denominator definitions in a simple table. Using Denominator Definitions to Display Basic Frequency Counts and Percentages illustrates how to specify denominator definitions in a
table that consists of multiple subtables. For
more examples of denominator definitions, see PROC TABULATE
by Example, Second Edition.
Specifying a Denominator for the PCTN Statistic
The following PROC TABULATE step calculates the N statistic
and three different versions of PCTN using the data set ENERGY.
proc tabulate data=energy;
   class division type;
   table division*
           (n='Number of customers'
            pctn<type>='% of row' 1
            pctn<division>='% of column'  2
            pctn='% of all customers'), 3
          type/rts=50;
   title 'Number of Users in Each Division';
run;
The TABLE statement
creates a row for each value of Division and a column for each value
of Type. Within each row, the TABLE statement nests four statistics:
N and three different calculations of PCTN. (See the following figure.)
Each occurrence of PCTN uses a different denominator definition.
Three Different Uses of the PCTN Statistic with Frequency Counts
Highlighted
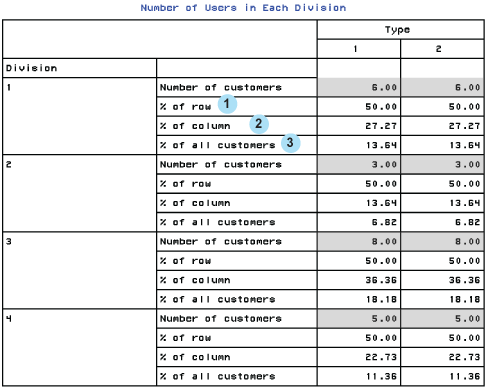
| 1 | <type> sums
the frequency counts for all occurrences of Type within the same value
of Division. Thus, for Division=1, the denominator is 6 + 6, or 12.
|
| 2 | <division> sums
the frequency counts for all occurrences of Division within the same
value of Type. Thus, for Type=1, the denominator is 6 + 3 + 8 + 5,
or 22.
|
| 3 | The third use of PCTN has no denominator definition. Omitting a denominator definition is the same as including all class variables in the denominator definition. Thus, for all cells, the denominator is 6 + 3 + 8 + 5 + 6 + 3 + 8 + 5, or 44. |
Specifying a Denominator for the PCTSUM Statistic
The following PROC TABULATE
step sums expenditures for each combination of Type and Division and
calculates three different versions of PCTSUM.
proc tabulate data=energy format=8.2;
   class division type;
   var expenditures;
   table division*
           (sum='Expenditures'*f=dollar10.2
            pctsum<type>='% of row' 1
            pctsum<division>='% of column' 2
            pctsum='% of all customers'), 3
         type*expenditures/rts=40;
   title 'Expenditures in Each Division';
run;
The TABLE statement
creates a row for each value of Division and a column for each value
of Type. Because Type is crossed with Expenditures, the value in each
cell is the sum of the values of Expenditures for all observations
that contribute to the cell. Within each row, the TABLE statement
nests four statistics: SUM and three different calculations of PCTSUM.
(See the following figure.) Each occurrence of PCTSUM uses a different
denominator definition.
Three Different Uses of the PCTSUM Statistic with Sums Highlighted
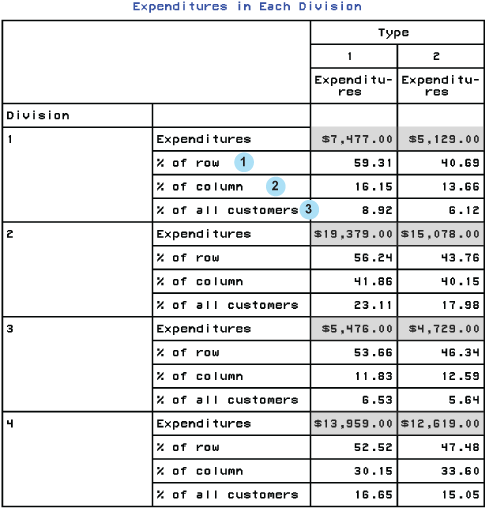
| 1 | <type> sums
the values of Expenditures for all occurrences of Type within the
same value of Division. Thus, for Division=1, the denominator is $7,477
+ $5,129.
|
| 2 | <division> sums
the frequency counts for all occurrences of Division within the same
value of Type. Thus, for Type=1, the denominator is $7,477 + $19,379
+ $5,476 + $13,959.
|
| 3 | The third use of PCTN has no denominator definition. Omitting a denominator definition is the same as including all class variables in the denominator definition. Thus, for all cells, the denominator is $7,477 + $19,379 + $5,476 + $13,959 + $5,129 + $15,078 + $4,729 + $12,619. |
Using Style Elements in PROC TABULATE
What Are Style Elements?
If you use the Output
Delivery System to create HTML, RTF, or Printer output from PROC TABULATE,
then you can set the style element that the procedure uses for various
parts of the table. Style elements determine presentation attributes,
such as font face, font weight, color, and so on. See Understanding Styles, Style Elements, and Style Attributes in SAS Output Delivery System: User's Guide for more information. See ODS Style Elements in SAS Output Delivery System: User's Guide for a comprehensive
list of style elements.
Using the STYLE= Option
You specify style elements for PROC
TABULATE with the STYLE= option. The following table shows where you
can use this option. Specifications in the TABLE statement override
the same specification in the PROC TABULATE statement. However, any
style attributes that you specify in the PROC TABULATE statement and
that you do not override in the TABLE statement are inherited. For
example, if you specify a blue background and a white foreground for
all data cells in the PROC TABULATE statement, and you specify a gray
background for the data cells of a particular crossing in the TABLE
statement, then the background for those data cells is gray, and the
foreground is white (as specified in the PROC TABULATE statement).
Applying Style Attributes to Table Cells
PROC TABULATE determines
the style attributes to use for a particular cell from the following
default order of precedence for styles:
-
If no other style attributes are specified, then PROC TABULATE uses the default style attributes from the default style (Data).
-
The STYLE= option in the PROC TABULATE statement changes the default style attributes. If no other STYLE= option specifications affect a cell, then PROC TABULATE uses these style attributes for that cell.
-
A STYLE= option that is specified in the page dimension applies to all the table cells on the logical page unless you specify another STYLE= option for a cell in the row or column dimension.
-
A STYLE= option that is specified in the row dimension applies to all the table cells in the row unless you specify another STYLE= option for a cell in the column dimension.
-
A STYLE= option that is specified in the column dimension applies to all the table cells in the column.
You can change this
order of precedence by using the STYLE_PRECEDENCE= option in the TABLE statement . For example, if you specify STYLE_PRECEDENCE=ROW and specify
a STYLE= option in the row dimension, then those style attribute values
override all others that are specified for the table cells.
Using a Format to Assign a Style Attribute
You can use a format
to assign a style attribute value to any cell whose content is determined
by values of a class or analysis variable. For example, the following
code assigns a red background to cells whose values are less than
10,000, a yellow background to cells whose values are at least 10,000
but less than 20,000, and a green background to cells whose values
are at least 20,000:
proc format;
   value expfmt low-<10000='red'
                      10000-<20000='yellow'
                      20000-high='green';
run;

ods html body='external-HTML-file';
proc tabulate data=energy style=[backgroundcolor=expfmt.];
   class region division type;
   var expenditures;
   table (region all)*(division all),
           type*expenditures;
run;
ods html close;
FOOTNOTE 1:You can use the BY statement without
sorting the data set if the data set has an index for the BY variable.[return]