TABULATE Procedure
- Syntax

- Overview
- Concepts
- Using
- Results
- Examples Creating a Basic Two-Dimensional TableSpecifying Class Variable Combinations to Appear in a TableUsing Preloaded Formats with Class VariablesUsing Multilabel FormatsCustomizing Row and Column HeadingsSummarizing Information with the Universal Class Variable ALLEliminating Row HeadingsIndenting Row Headings and Eliminating Horizontal SeparatorsCreating Multipage TablesReporting on Multiple-Response Survey DataReporting on Multiple-Choice Survey DataCalculating Various Percentage StatisticsUsing Denominator Definitions to Display Basic Frequency Counts and PercentagesSpecifying Style Elements for ODS OutputStyle PrecedenceNOCELLMERGE Option
- References
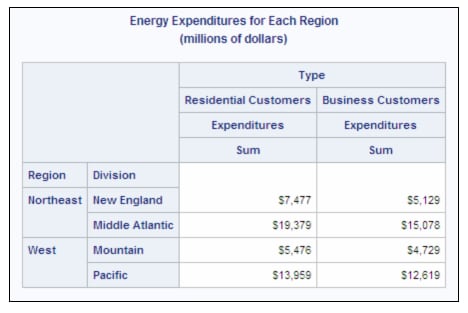
Example 1: Creating a Basic Two-Dimensional Table
| Features: |
PROC TABULATE statement options: FORMAT= TABLE statement: crossing (*) operator TABLE statement options: RTS= |
| Other features: |
FORMAT statement |
| Data set: | ENERGY |
Program
data energy;
   length State $2;
   input Region Division state $ Type Expenditures;
   datalines;
1 1 ME 1 708
1 1 ME 2 379

 ... more data lines ...

4 4 HI 1 273
4 4 HI 2 298
;
proc format;
   value regfmt 1='Northeast'
                2='South'
                3='Midwest'
                4='West';
   value divfmt 1='New England'
                2='Middle Atlantic'
                3='Mountain'
                4='Pacific';
   value usetype 1='Residential Customers'
                 2='Business Customers';
run;
proc tabulate data=energy format=dollar12.;
class region division type;
var expenditures;
    table region*division,
          type*expenditures
/ rts=25;
format region regfmt. division divfmt. type usetype.;
   title 'Energy Expenditures for Each Region';
   title2 '(millions of dollars)';
run;
Program Description
Create the ENERGY data set.ENERGY
contains data on expenditures of energy for business and residential
customers in individual states in the Northeast and West regions of
the United States. A DATA step creates the data set.
data energy;
   length State $2;
   input Region Division state $ Type Expenditures;
   datalines;
1 1 ME 1 708
1 1 ME 2 379

 ... more data lines ...

4 4 HI 1 273
4 4 HI 2 298
;
Create the REGFMT., DIVFMT., and USETYPE. formats.PROC FORMAT creates formats for Region, Division,
and Type.
proc format;
   value regfmt 1='Northeast'
                2='South'
                3='Midwest'
                4='West';
   value divfmt 1='New England'
                2='Middle Atlantic'
                3='Mountain'
                4='Pacific';
   value usetype 1='Residential Customers'
                 2='Business Customers';
run;
Specify the table options.The
FORMAT= option specifies DOLLAR12. as the default format for the value
in each table cell.
Specify subgroups for the analysis.The CLASS statement separates the analysis by values
of Region, Division, and Type.
Specify the analysis variable.The
VAR statement specifies that PROC TABULATE calculate statistics on
the Expenditures variable.
Define the table rows and columns.The TABLE statement creates a row for each formatted
value of Region. Nested within each row are rows for each formatted
value of Division. The TABLE statement also creates a column for each
formatted value of Type. Each cell that is created by these rows and
columns contains the sum of the analysis variable Expenditures for
all observations that contribute to that cell.