Procedure Concepts

Input Data Sets

Many Base SAS procedures require an input SAS data set. You specify the input SAS data set by using the DATA= option in the procedure statement, as in this example:
proc print data=emp;
If you omit the DATA= option, the procedure uses the value of the SAS system option _LAST_=. The default of _LAST_= is the most recently created SAS data set in the current SAS job or session. _LAST_= is described in detail in the SAS Data Set Options: Reference.

RUN-Group Processing

RUN-group processing enables you to submit a PROC step with a RUN statement without ending the procedure. You can continue to use the procedure without issuing another PROC statement. To end the procedure, use a RUN CANCEL or a QUIT statement. Several Base SAS procedures support RUN-group processing:
CATALOG DATASETS PLOT PMENU TRANTAB
See the section on the individual procedure for more information.
Note: PROC SQL executes each query automatically. Neither the RUN nor RUN CANCEL statement has any effect.

Creating Titles That Contain BY-Group Information

BY-Group Processing

BY-group processing uses a BY statement to process observations that are ordered, grouped, or indexed according to the values of one or more variables. By default, when you use BY-group processing in a procedure step, a BY line identifies each group. This section explains how to create titles that serve as customized BY lines.

Suppressing the Default BY Line

When you insert BY-group processing information into a title, you usually want to suppress the default BY line. To suppress it, use the SAS system option NOBYLINE.
Note: You must use the NOBYLINE option if you insert BY-group information into titles for the following procedures:
  • MEANS
  • PRINT
  • STANDARD
  • SUMMARY
If you use the BY statement with the NOBYLINE option, then these procedures always start a new page for each BY group. This behavior prevents multiple BY groups from appearing on a single page and ensures that the information in the titles matches the report on the pages.

Inserting BY-Group Information into a Title

The general form for inserting BY-group information into a title is as follows:
#BY-specification<.suffix>
BY-specification
is one of the following specifications:
BYVALn | BYVAL(BY-variable)
places the value of the specified BY variable in the title. You specify the BY variable with one of the following options:
n is the nth BY variable in the BY statement.
BY-variable is the name of the BY variable whose value you want to insert in the title.
BYVARn | BYVAR(BY-variable)
places the label or the name (if no label exists) of the specified BY variable in the title. You designate the BY variable with one of the following options:
n is the nth BY variable in the BY statement.
BY-variable is the name of the BY variable whose name you want to insert in the title.
BYLINE
inserts the complete default BY line into the title.
suffix
supplies text to place immediately after the BY-group information that you insert in the title. No space appears between the BY-group information and the suffix.

Example: Inserting a Value from Each BY Variable into the Title

This example demonstrates these actions:
  1. creates a data set, GROC, that contains data for stores from four regions. Each store has four departments. See GROC for the DATA step that creates the data set.
  2. sorts the data by Region and Department.
  3. uses the SAS system option NOBYLINE to suppress the BY line that normally appears in output that is produced with BY-group processing.
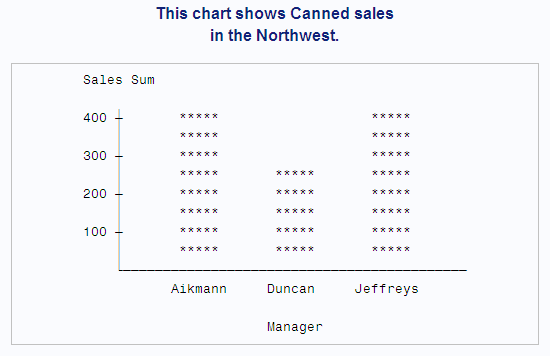
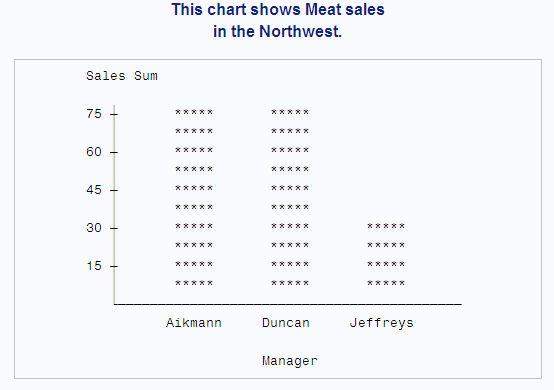
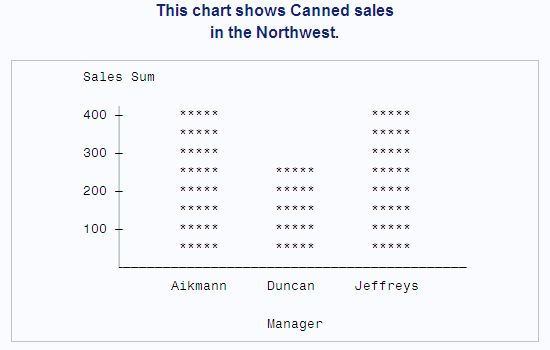
  4. uses PROC CHART to chart sales by Region and Department. In the first TITLE statement, #BYVAL2 inserts the value of the second BY variable, Department, into the title. In the second TITLE statement, #BYVAL(Region) inserts the value of Region into the title. The first period after Region indicates that a suffix follows. The second period is the suffix.
  5. uses the SAS system option BYLINE to return to the creation of the default BY line with BY-group processing.
data groc; 1
   input Region $9. Manager $ Department $ Sales;
   datalines;
Southeast    Hayes       Paper       250
Southeast    Hayes       Produce     100
Southeast    Hayes       Canned      120
Southeast    Hayes       Meat         80
...more lines of data...
Northeast    Fuller      Paper       200
Northeast    Fuller      Produce     300
Northeast    Fuller      Canned      420
Northeast    Fuller      Meat        125
;
proc sort data=groc;  2
   by region department;
run;
options nobyline nodate pageno=1
        linesize=64 pagesize=20;  3
proc chart data=groc;  4
   by region department;
   vbar manager / type=sum sumvar=sales;
   title1 'This chart shows #byval2 sales';
   title2 'in the #byval(region)..';
run;
options byline;  5
This partial output shows two BY groups with customized BY lines:
A chart that shows Canned sales in the Northwest.
A chart that shows Meat sales in the Northwest.

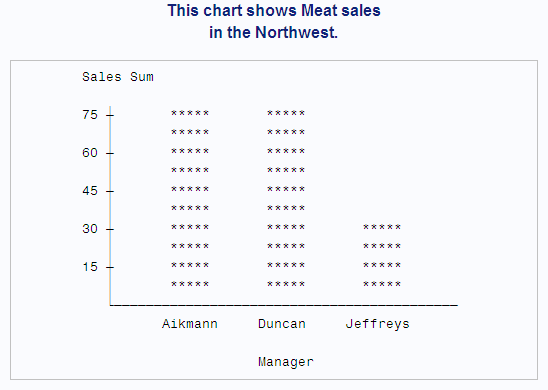
Example: Inserting the Name of a BY Variable into a Title

This example inserts the name of a BY variable and the value of a BY variable into the title. The program does these actions.
  1. uses the SAS system option NOBYLINE to suppress the BY line that normally appears in output that is produced with BY-group processing.
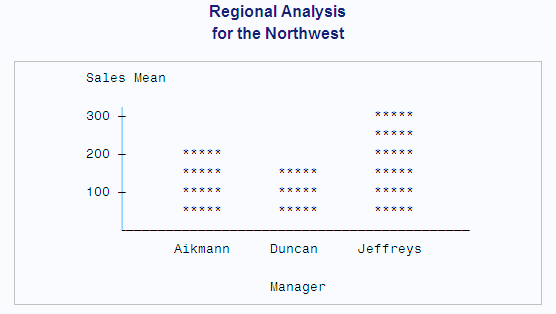
  2. uses PROC CHART to chart sales by Region. In the first TITLE statement, #BYVAR(Region) inserts the name of the variable Region into the title. (If Region had a label, #BYVAR would use the label instead of the name.) The suffix al is appended to the label. In the second TITLE statement, #BYVAL1 inserts the value of the first BY variable, Region, into the title.
  3. uses the SAS system option BYLINE to return to the creation of the default BY line with BY-group processing.
options nobyline nodate pageno=1
        linesize=64 pagesize=20;  1
proc chart data=groc;   2
   by region;
   vbar manager / type=mean sumvar=sales;
   title1 '#byvar(region).al Analysis';
   title2 'for the #byval1';
run;
options byline;  3
This partial output shows one BY group with a customized BY line:
A chart that shows Regional Analysis for the Northwest.

Example: Inserting the Complete BY Line into a Title

This example inserts the complete BY line into the title. The program does these actions:
  1. uses the SAS system option NOBYLINE to suppress the BY line that normally appears in output that is produced with BY-group processing.
  2. uses PROC CHART to chart sales by Region and Department. In the TITLE statement, #BYLINE inserts the complete BY line into the title.
  3. uses the SAS system option BYLINE to return to the creation of the default BY line with BY-group processing.
options nobyline nodate pageno=1
        linesize=64 pagesize=20;  1
proc chart data=groc;  2
   by region department;
   vbar manager / type=sum sumvar=sales;
   title 'Information for #byline';
run;
options byline;  3
This partial output shows two BY groups with customized BY lines:
A chart that shows Canned sales in the Northwest.
A chart that shows Meat sales in the Nothwest.

Error Processing of BY-Group Specifications

SAS does not issue error or warning messages for incorrect #BYVAL, #BYVAR, or #BYLINE specifications. Instead, the text of the item becomes part of the title.

Shortcuts for Specifying Lists of Variable Names

Several statements in procedures allow multiple variable names. You can use these shortcut notations instead of specifying each variable name:
Notation
Meaning
x1-xn
Specifies variables X1 through Xn. The numbers must be consecutive.
x:
Specifies all variables that begin with the letter X.
x--a
Specifies all variables between X and A, inclusive. This notation uses the position of the variables in the data set.
x-numeric-a
Specifies all numeric variables between X and A, inclusive. This notation uses the position of the variables in the data set.
x-character-a
Specifies all character variables between X and A, inclusive. This notation uses the position of the variables in the data set.
_numeric_
Specifies all numeric variables.
_character_
Specifies all character variables.
_all_
Specifies all variables.
Note: You cannot use shortcuts to list variable names in the INDEX CREATE statement in PROC DATASETS.
For more information, see the SAS Language Reference: Concepts.

Formatted Values

Using Formatted Values

Typically, when you print or group variable values, Base SAS procedures use the formatted values. This section contains examples of how Base SAS procedures use formatted values.

Example: Printing the Formatted Values for a Data Set

The following example prints the formatted values of the data set PROCLIB.PAYROLL. (For details about the DATA step that creates this data set, see PROCLIB.PAYROLL.) In PROCLIB.PAYROLL, the variable Jobcode indicates the job and level of the employee. For example, TA1 indicates that the employee is at the beginning level for a ticket agent.
options nodate pageno=1
        linesize=64 pagesize=40;
proc print data=proclib.payroll(obs=10)
           noobs;
   title  'PROCLIB.PAYROLL';
   title2 'First 10 Observations Only';
run;
The following example is a partial printing of PROCLIB.PAYROLL:
A chart that shows the first ten Observations of PROCLIB.PAYROLL.
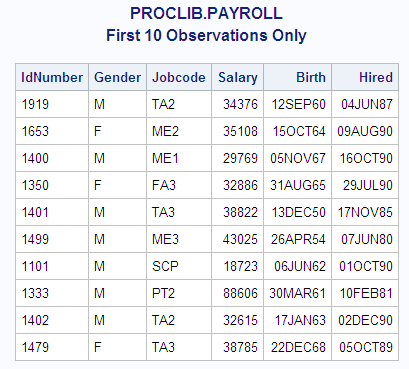
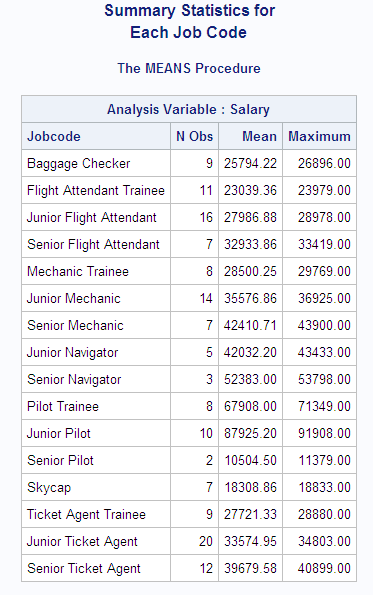
The following PROC FORMAT step creates the format $JOBFMT., which assigns descriptive names for each job:
proc format;
    value $jobfmt
          'FA1'='Flight Attendant Trainee'
          'FA2'='Junior Flight Attendant'
          'FA3'='Senior Flight Attendant'
          'ME1'='Mechanic Trainee'
          'ME2'='Junior Mechanic'
          'ME3'='Senior Mechanic'
          'PT1'='Pilot Trainee'
          'PT2'='Junior Pilot'
          'PT3'='Senior Pilot'
          'TA1'='Ticket Agent Trainee'
          'TA2'='Junior Ticket Agent'
          'TA3'='Senior Ticket Agent'
          'NA1'='Junior Navigator'
          'NA2'='Senior Navigator'
          'BCK'='Baggage Checker'
          'SCP'='Skycap';
run;
The FORMAT statement in this PROC MEANS step temporarily associates the $JOBFMT. format with the variable Jobcode:
options nodate pageno=1
        linesize=64 pagesize=60;
proc means data=proclib.payroll mean max;
   class jobcode;
   var salary;
   format jobcode $jobfmt.;
   title 'Summary Statistics for';
   title2 'Each Job Code';
run;
PROC MEANS produces this output, which uses the $JOBFMT. format:
A chart that shows the PROC Means output for Summary Statistics for Each Job Code
Note: Because formats are character strings, formats for numeric variables are ignored when the values of the numeric variables are needed for mathematical calculations.

Example: Grouping or Classifying Formatted Data

If you use a formatted variable to group or classify data, then the procedure uses the formatted values. The following example creates and assigns a format, $CODEFMT., that groups the levels of each job code into one category. PROC MEANS calculates statistics based on the groupings of the $CODEFMT. format.
proc format;
    value $codefmt
          'FA1','FA2','FA3'='Flight Attendant'
          'ME1','ME2','ME3'='Mechanic'
          'PT1','PT2','PT3'='Pilot'
          'TA1','TA2','TA3'='Ticket Agent'
                'NA1','NA2'='Navigator'
                      'BCK'='Baggage Checker'
                      'SCP'='Skycap';
run;

options nodate pageno=1
        linesize=64 pagesize=40;
proc means data=proclib.payroll mean max;
   class jobcode;
   var salary;
   format jobcode $codefmt.;
   title 'Summary Statistics for Job Codes';
   title2 '(Using a Format that Groups the Job Codes)';
run;
PROC MEANS produces this output:
A chart that show the PROC MEANS output for Summary Statistics for Job Codes (Using a Format that Groups the Job Codes).

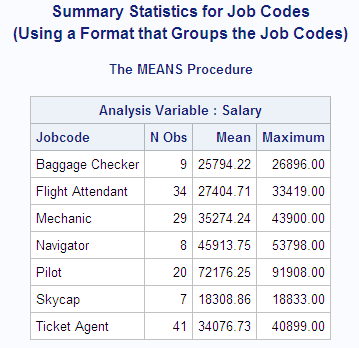
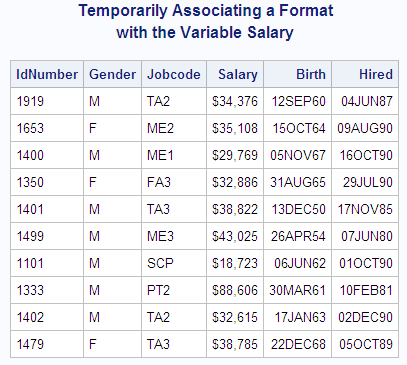
Example: Temporarily Associating a Format with a Variable

If you want to associate a format with a variable temporarily, then you can use the FORMAT statement. For example, the following PROC PRINT step associates the DOLLAR8. format with the variable Salary for the duration of this PROC PRINT step only:
options nodate pageno=1
        linesize=64 pagesize=40;
proc print data=proclib.payroll(obs=10)
           noobs;
   format salary dollar8.;
   title 'Temporarily Associating a Format';
   title2 'with the Variable Salary';
run;
PROC PRINT produces this output:
A chart that shows the PROC PRINT output for Temporarily Associating a Format with the Variable Salary.

Example: Temporarily Dissociating a Format from a Variable

If a variable has a permanent format that you do not want a procedure to use, then temporarily dissociate the format from the variable by using a FORMAT statement.
In this example, the FORMAT statement in the DATA step permanently associates the $YRFMT. variable with the variable Year. Thus, when you use the variable in a PROC step, the procedure uses the formatted values. The PROC MEANS step, however, contains a FORMAT statement that dissociates the $YRFMT. format from Year for this PROC MEANS step only. PROC MEANS uses the stored value for Year in the output.
proc format;
   value $yrfmt  '1'='Freshman'
                 '2'='Sophomore'
                 '3'='Junior'
                 '4'='Senior';
run;
data debate;
    input Name $ Gender $  Year $  GPA  @@;
    format year $yrfmt.;
    datalines;
Capiccio m 1 3.598 Tucker   m 1 3.901
Bagwell  f 2 3.722 Berry    m 2 3.198
Metcalf  m 2 3.342 Gold     f 3 3.609
Gray     f 3 3.177 Syme     f 3 3.883
Baglione f 4 4.000 Carr     m 4 3.750
Hall     m 4 3.574 Lewis    m 4 3.421
;

options nodate pageno=1
        linesize=64 pagesize=40;
proc means data=debate mean maxdec=2;
   class year;
   format year;
   title 'Average GPA';
run;
PROC MEANS produces this output, which does not use the YRFMT. format:
A chart that shows the PROC MEANS output for Average GPA.

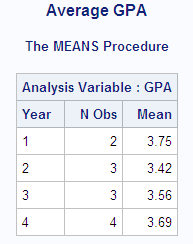
Formats and BY-Group Processing

When a procedure processes a data set, it checks to determine whether a format is assigned to the BY variable. If it is, then the procedure adds observations to the current BY groups until the formatted value changes. If nonconsecutive internal values of the BY variables have the same formatted value, then the values are grouped into different BY groups. Therefore, two BY groups are created with the same formatted value. Also, if different and consecutive internal values of the BY variables have the same formatted value, then they are included in the same BY group.

Formats and Error Checking

If SAS cannot find a format, then it stops processing and prints an error message in the SAS log. You can suppress this behavior with the SAS system option NOFMTERR. If you use NOFMTERR, and SAS cannot find the format, then SAS uses a default format and continues processing. Typically, for the default, SAS uses the BEST w. format for numeric variables and the $w. format for character variables.
Note: To ensure that SAS can find user-written formats, use the SAS system option FMTSEARCH=. How to store formats is described in Storing Informats and Formats .

Processing All the Data Sets in a Library

You can use the SAS Macro Facility to run the same procedure on every data set in a library. The macro facility is part of the Base SAS software.
Printing All the Data Sets in a SAS Library shows how to print all the data sets in a library. You can use the same macro definition to perform any procedure on all the data sets in a library. Simply replace the PROC PRINT piece of the program with the appropriate procedure code.

Operating Environment-Specific Procedures

Several Base SAS procedures are specific to one operating environment or one release. Descriptions of Operating Environment-Specific Procedures contains a table with additional information. These procedures are described in more detail in the SAS documentation for operating environments.

Statistic Descriptions

The following table identifies common descriptive statistics that are available in several Base SAS procedures. For more detailed information about available statistics and theoretical information, see Keywords and Formulas.
Common Descriptive Statistics That Base SAS Procedures Calculate
Statistic
Description
Procedures
Confidence intervals
FREQ, MEANS or SUMMARY, TABULATE, UNIVARIATE
CSS
Corrected sum of squares
CORR, MEANS or SUMMARY, REPORT, SQL, TABULATE, UNIVARIATE
CV
Coefficient of variation
MEANS or SUMMARY, REPORT, SQL, TABULATE, UNIVARIATE
Goodness-of-fit tests
FREQ, UNIVARIATE
KURTOSIS
Kurtosis
MEANS or SUMMARY, TABULATE, UNIVARIATE
MAX
Largest (maximum) value
CORR, MEANS or SUMMARY, REPORT, SQL, TABULATE, UNIVARIATE
MEAN
Mean
CORR, MEANS or SUMMARY, REPORT, SQL, TABULATE, UNIVARIATE
MEDIAN
Median (50th percentile)
CORR (for nonparametric correlation measures), MEANS or SUMMARY, TABULATE, UNIVARIATE
MIN
Smallest (minimum) value
CORR, MEANS or SUMMARY, REPORT, SQL, TABULATE, UNIVARIATE
MODE
Most frequent value (if not unique, the smallest mode is used)
UNIVARIATE
N
Number of observations on which calculations are based
CORR, FREQ, MEANS or SUMMARY, REPORT, SQL, TABULATE, UNIVARIATE
NMISS
Number of missing values
FREQ, MEANS or SUMMARY, REPORT, SQL, TABULATE, UNIVARIATE
NOBS
Number of observations
MEANS or SUMMARY, UNIVARIATE
PCTN
Percentage of a cell or row frequency to a total frequency
REPORT, TABULATE
PCTSUM
Percentage of a cell or row sum to a total sum
REPORT, TABULATE
Pearson correlation
CORR
Percentiles
FREQ, MEANS or SUMMARY, REPORT, TABULATE, UNIVARIATE
RANGE
Range
CORR, MEANS or SUMMARY, REPORT, SQL, TABULATE, UNIVARIATE
Robust statistics
Trimmed means, Winsorized means
UNIVARIATE
SKEWNESS
Skewness
MEANS or SUMMARY, TABULATE, UNIVARIATE
Spearman correlation
CORR
STD
Standard deviation
CORR, MEANS or SUMMARY, REPORT, SQL, TABULATE, UNIVARIATE
STDERR
Standard error of the mean
MEANS or SUMMARY, REPORT, SQL, TABULATE, UNIVARIATE
SUM
sum
CORR, MEANS or SUMMARY, REPORT, SQL, TABULATE, UNIVARIATE
SUMWGT
Sum of weights
CORR, MEANS or SUMMARY, REPORT, SQL, TABULATE, UNIVARIATE
Tests of location
UNIVARIATE
USS
Uncorrected sum of squares
CORR, MEANS or SUMMARY, REPORT, SQL, TABULATE, UNIVARIATE
VAR
Variance
CORR, MEANS or SUMMARY, REPORT, SQL, TABULATE, UNIVARIATE

Computational Requirements for Statistics

The following computational requirements are for the statistics that are listed in Common Descriptive Statistics That Base SAS Procedures Calculate. They do not describe recommended sample sizes.
  • N and NMISS do not require any nonmissing observations.
  • SUM, MEAN, MAX, MIN, RANGE, USS, and CSS require at least one nonmissing observation.
  • VAR, STD, STDERR, and CV require at least two observations.
  • CV requires that MEAN is not equal to zero.
Statistics are reported as missing if they cannot be computed.