The GANTT Procedure
- Overview
- Getting Started
-
Syntax

-
DetailsSchedule Data SetMissing Values in Input Data SetsSpecifying the PADDING= OptionPage FormatMultiple Calendars and HolidaysFull-Screen VersionGraphics VersionSpecifying the Logic OptionsAutomatic Text AnnotationWeb-Enabled Gantt ChartsMode-Specific DifferencesDisplayed OutputMacro Variable _ORGANTTComputer Resource RequirementsODS Style Templates
-
ExamplesLine-Printer ExamplesPrinting a Gantt ChartCustomizing the Gantt ChartGraphics ExamplesMarking HolidaysMarking Milestones and Special DatesUsing the COMPRESS OptionUsing the MININTERVAL= and SCALE= OptionsUsing the MINDATE= and MAXDATE= OptionsVariable-Length HolidaysMultiple CalendarsPlotting the Actual ScheduleComparing Progress Against a Baseline ScheduleUsing the COMBINE OptionPlotting the Resource-Constrained ScheduleSpecifying the Schedule Data DirectlyBY ProcessingGantt Charts by PersonsUsing the HEIGHT= and HTOFF= OptionsDrawing a Logic Gantt Chart Using AON RepresentationSpecifying the Logic Control OptionsNonstandard Precedence RelationshipsUsing the SAS/GRAPH ANNOTATE= OptionUsing the Automatic Text Annotation FeatureMultiproject Gantt ChartsMultisegment Gantt ChartsZoned Gantt ChartsWeb-Enabled Gantt ChartsUsing the CHARTWIDTH= OptionUsing the TIMEAXISFORMAT= OptionStatement and Option Cross-Reference Tables
- References
Example 8.27 Using the CHARTWIDTH= Option
This example illustrates the use of the CHARTWIDTH= option to create Gantt charts that are consistent in appearance. The data
set used in this example is the SAVE data set created in Example 8.6.
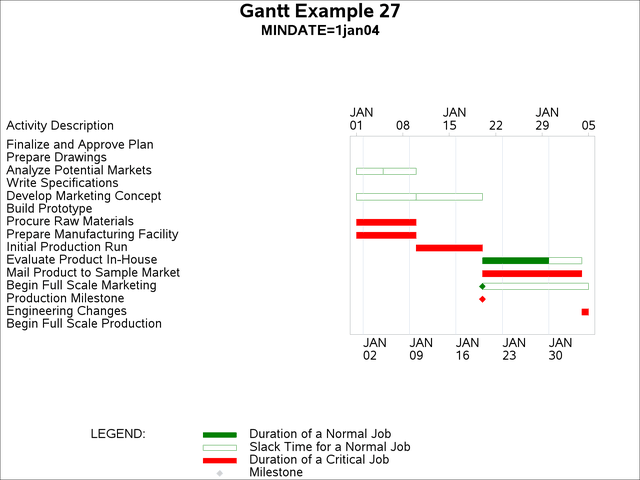
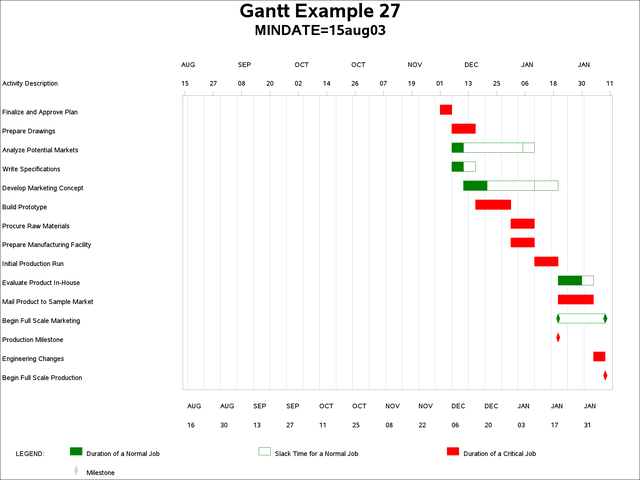
Gantt charts are first produced using different values of the MINDATE= option, and without specifying the CHARTWIDTH= option. Output 8.27.1 shows a Gantt chart using MINDATE='1jan04', and Output 8.27.2 shows a Gantt chart using MINDATE='15aug03'. Notice that the chart in Output 8.27.2 has a much larger chart area than the chart in Output 8.27.1, and the 'Activity Description' column is compressed and rather difficult to read.
proc gantt data=save;
   chart / mindate='1jan04'd maxdate='1feb04'd
           dur=days nojobnum compress height=2.0
           ref='2jan04'd to '2feb04'd by week
           reflabel;
   id descrpt;
   run;
proc gantt data=save;
   chart / mindate='15aug03'd maxdate='1feb04'd
           dur=days nojobnum compress height=2.0
           ref='16aug03'd to '2feb04'd by week
           reflabel;
   id descrpt;
   run;
Output 8.27.1: Without the CHARTWIDTH= Option (MINDATE=1Jan04)
Output 8.27.2: Without the CHARTWIDTH= Option (MINDATE=15Aug03)
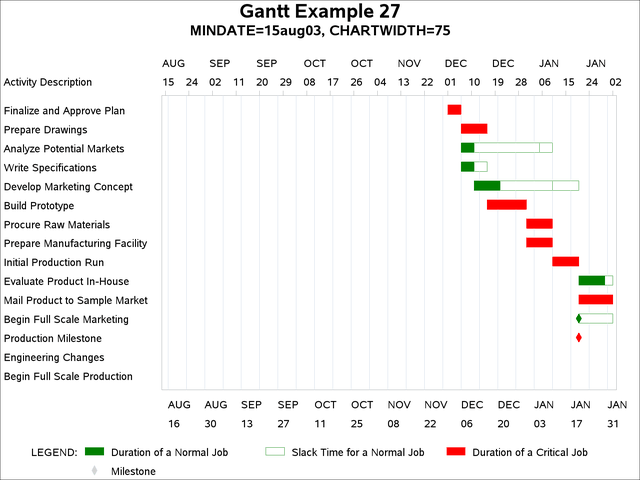
The same charts are now plotted with the CHARTWIDTH= option. The specification CHARTWIDTH=75 indicates that the chart is rescaled so the axis area is 75% of the chart width and the text area is 25% of the chart width. Therefore, specifying CHARTWIDTH=75 for both charts gives the two charts a consistent appearance. The output is shown in Output 8.27.3 and Output 8.27.4.
proc gantt data=save;
   chart / mindate='1jan04'd maxdate='1feb04'd
           dur=days nojobnum compress height=2.0
           ref='2jan04'd to '2feb04'd by week
           reflabel chartwidth=75;
   id descrpt;
   run;
proc gantt data=save;
   chart / mindate='15aug03'd maxdate='1feb04'd
           dur=days nojobnum compress height=2.0
           ref='16aug03'd to '2feb04'd by week
           reflabel chartwidth=75;
   id descrpt;
   run;
Output 8.27.3: Using the CHARTWIDTH= Option (MINDATE=1Jan04)
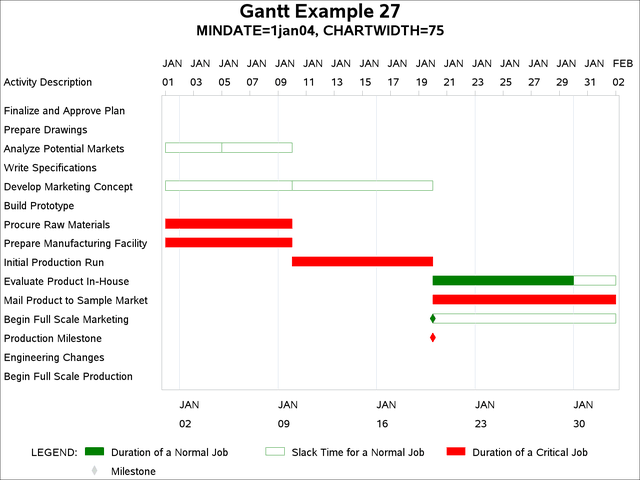
Output 8.27.4: Using the CHARTWIDTH= Option (MINDATE=15Aug03)