The GANTT Procedure
- Overview
- Getting Started
-
Syntax

-
DetailsSchedule Data SetMissing Values in Input Data SetsSpecifying the PADDING= OptionPage FormatMultiple Calendars and HolidaysFull-Screen VersionGraphics VersionSpecifying the Logic OptionsAutomatic Text AnnotationWeb-Enabled Gantt ChartsMode-Specific DifferencesDisplayed OutputMacro Variable _ORGANTTComputer Resource RequirementsODS Style Templates
-
ExamplesLine-Printer ExamplesPrinting a Gantt ChartCustomizing the Gantt ChartGraphics ExamplesMarking HolidaysMarking Milestones and Special DatesUsing the COMPRESS OptionUsing the MININTERVAL= and SCALE= OptionsUsing the MINDATE= and MAXDATE= OptionsVariable-Length HolidaysMultiple CalendarsPlotting the Actual ScheduleComparing Progress Against a Baseline ScheduleUsing the COMBINE OptionPlotting the Resource-Constrained ScheduleSpecifying the Schedule Data DirectlyBY ProcessingGantt Charts by PersonsUsing the HEIGHT= and HTOFF= OptionsDrawing a Logic Gantt Chart Using AON RepresentationSpecifying the Logic Control OptionsNonstandard Precedence RelationshipsUsing the SAS/GRAPH ANNOTATE= OptionUsing the Automatic Text Annotation FeatureMultiproject Gantt ChartsMultisegment Gantt ChartsZoned Gantt ChartsWeb-Enabled Gantt ChartsUsing the CHARTWIDTH= OptionUsing the TIMEAXISFORMAT= OptionStatement and Option Cross-Reference Tables
- References
Graphics Version
Formatting the Chart
If necessary, PROC GANTT divides the Gantt chart into several pages. You can force the Gantt chart to fit on one page by specifying the COMPRESS option in the CHART statement. You can achieve a similar result using the PCOMPRESS option, which also maintains the aspect ratio. In addition, you can fit the chart into a prescribed number of horizontal and vertical pages by using the HPAGES= and VPAGES= options in the CHART statement.
The amount of information contained on each page is determined by the values of the graphics options HPOS= and VPOS= specified in a GOPTIONS statement. If any compression of the Gantt chart is performed, the values of HPOS and VPOS are increased, as necessary, to the number of rows and columns respectively, that the entire chart occupies in uncompressed mode. The default height of each row of the Gantt chart is computed as (100/v)% of the screen height where VPOS=v. Thus, the larger the value of VPOS, the narrower the row. You can control the default bar height and default bar offset by using the BARHT= option and the BAROFF= option, respectively. You can further override these at the schedule level. For example, the ABARHT= option affects only the height of the actual schedule bars. The screen is assumed to be divided into h columns where HPOS=h; thus, each column is assumed to be as wide as (100/h)% of the screen width. Hence, the specifications SCALE= 10 and MININTERVAL= WEEK imply that a duration of one week is denoted by a bar of length (1000/h)% of the screen width.
The height of the text characters is controlled by both the HEIGHT= option in the CHART statement and the HTEXT= option specified in a GOPTIONS statement. The text height is set equal to the product of the HEIGHT= and HTEXT= values. (If neither the HEIGHT= option nor the HTEXT= option has been specified, the text height is given by the font size attribute of the GraphDataText element of the current ODS style template. See the section ODS Style Templates for more information about ODS styles.) The units in which the text height is measured are those of the HTEXT= option. By default, the value of HEIGHT= is 1, which sets the text height to be equal to the HTEXT= value. The default value of HTEXT= is 1 unit, where a unit is defined by the GUNIT= option in a GOPTIONS statement. Thus, in the absence of the HEIGHT=, HTEXT=, and GUNIT= options, and with no font size provided by the current ODS style template, the text height is the same as the bar height, namely one cell height. Increasing the value of HEIGHT= is useful when you use the COMPRESS option, particularly when you have a very large chart. Since the chart is scaled as appropriate to fit on one page, the text can be very hard to discern, or even illegible, and would benefit from enlargement. Relative positioning of the font baseline for activity text is controlled by the HTOFF= option in the CHART statement. By default, the font baseline for an activity is at the bottom of the first bar corresponding to the activity.
The color of the text characters is specified by using the CTEXT= option in the CHART statement. The default color depends on the GOPTIONS statement and the GSTYLE system option; see the section ODS Style Templates for more information. You can override the text colors for selected columns of activity text at the activity level by using a PATTERN variable in the Schedule data set and specifying the CTEXTCOLS= option in the CHART statement.
The font used for the text characters is specified with the FONT= option in the CHART statement. The default font depends on the GOPTIONS statement and the GSTYLE system option; see the section ODS Style Templates for more information.
Global PATTERN statements are used to specify the fill pattern for the different types of bars drawn on the Gantt chart. Each fill pattern can be associated with a color. Patterns can be used to reflect the status of an activity (normal, critical, supercritical) in the predicted early/late schedule, to indicate the different schedule types (actual, resource-constrained, baseline), and to represent weekends, holidays and breaks on the Gantt chart. See the section Using PATTERN Statements for details. In addition, you can override these fill patterns for selected schedules at an activity level by using a PATTERN variable in the Schedule data set and specifying the PATLEVEL= option in the CHART statement.
You can use global SYMBOL statements to define the symbols that represent CHART variables in the Gantt chart. The SYMBOL statement enables you to select symbols from different fonts and modify their appearance to suit your requirements. You can specify a color and a height for the symbol in addition to a variety of other options. See the section Using SYMBOL Statements for details.
Annotate Processing
The Annotate facility enables you to enhance graphics output produced by PROC GANTT. However, if the only items being annotated are symbols and text strings, it is recommended that you use the Automatic Text Annotation facility that is built into the Gantt procedure instead. This facility was developed specifically for labeling Gantt charts; it has some very useful features and requires a minimum of effort.
To use the SAS/GRAPH Annotate facility, you must create an Annotate data set that contains a set of graphics commands that can be superimposed on the Gantt chart. This data set has a specific format and must contain key variables. Each observation in the Annotate data set represents a command to draw a graphics element or perform an action. The values of the variables in the observation determine what is done and how it is done. The observations in an Annotate data set can be created by explicitly assigning values to the Annotate variables through a DATA step or SAS/FSP procedure or by implicitly assigning values with Annotate macros within a SAS DATA step. The process of creating Annotate observations is greatly simplified through the use of Annotate macros.
Coordinates specify where graphic elements are to be positioned. A coordinate system, in turn, determines how coordinates are interpreted. There are several different coordinate systems that are used by the Annotate facility. Typically, one of three major drawing areas can be associated with any coordinate system: data area, procedure output area, and graphics output area. This chapter explains the coordinate system that is based on the data area of PROC GANTT.
When annotating a graph produced by any of the graphics procedures, you may find it helpful to use data coordinates that refer to the data values corresponding to the graph that is being annotated. For example, if you want to label a particular activity of a Gantt chart with additional text, you can position the text accurately if you use data coordinates instead of screen coordinates. With respect to PROC GANTT, the Annotate facility uses the time axis and the activity axis of the Gantt chart as the basis for the data coordinate system. To use this feature, create a Annotate data set based on the Schedule data set that is input to the procedure, utilizing Annotate macros whenever possible to simplify the process.
Note: The data coordinate system enables you to annotate the graph even if it spans multiple pages. However, each annotation must be entirely contained within a given page. For example, you cannot annotate a line on the Gantt chart that runs from one page of the chart to another.
In addition to a coordinate system based on the data, you can select a coordinate system based on either the procedure output area or the Graphics output area. You would typically need to use one of these systems, for example, if you want to annotate text outside the chart area.
Using PATTERN Statements
PROC GANTT uses those patterns that are available with the GCHART procedure. PROC GANTT uses a maximum of nine different patterns to denote various phases in an activity’s duration and the various types of schedules that are plotted. Patterns are specified in PATTERN statements that can be used anywhere in your SAS program. Table 8.7 lists the function of each of the first nine PATTERN statements that are used by PROC GANTT.
Any PATTERN statements that you specify are used. If more are needed, default PATTERN statements are used.
You can override any of these patterns at the activity level by using a PATTERN variable in the schedule data set. A PATTERN variable is identified by specifying the PATTERN= option in the CHART statement or by the presence of the default _PATTERN variable.
Table 8.7: PATTERN Statements used by PROC GANTT
|
PATTERN |
Used to Denote |
|
1 |
Duration of a noncritical activity |
|
2 |
Slack time for a noncritical activity |
|
3 |
Duration of a critical activity |
|
4 |
Slack time for a supercritical activity |
|
5 |
Duration of a supercritical activity |
|
6 |
Actual duration of an activity |
|
7 |
Break due to a holiday |
|
8 |
Resource-constrained duration of an activity |
|
9 |
Baseline duration of an activity |
Refer to the SAS/GRAPH documentation for a detailed description of PATTERN statements. Most of the relevant information is reproduced here for the sake of completeness.
PATTERN Statement Syntax
The general form of a PATTERN statement is
PATTERNn options;
where
-
n is a number ranging from 1 to 255. If you do not specify a number after the keyword PATTERN, PATTERN1 is assumed.
-
options enables you to specify the colors and patterns used to fill the bars in your output.
PATTERN statements are additive; if you specify a C= or V= option in a PATTERN statement and then omit that option in a later PATTERN statement ending in the same number, the option remains in effect. To turn off options specified in a previous PATTERNn statement, either specify all options in a new PATTERNn statement, or use the keyword PATTERNn followed by a semicolon. For example, the following statement turns off any C= or V= option specified in previous PATTERN3 statements:
pattern3;
You can reset options in PATTERN statements to their default values by specifying a null value. A comma can be used (but is not required) to separate a null parameter from the next option.
For example, both of the following statements cause the C= option to assume its default value (the value of the CPATTERN= option or the first color in the COLORS= list):
pattern c=, v=solid;
or
pattern c= v=solid;
In the following statement, both options are reset to their default values:
pattern2 c= v=;
You can also turn off options by specifying the RESET= option in a GOPTIONS statement.
General options
You can specify the following options in a PATTERN statement.
-
COLOR= color
C= color -
specifies the color to use for a bar or other area to be filled. If you do not specify the C= option in a PATTERN statement, the procedure uses the value you specified for the CPATTERN= option in a GOPTIONS statement. If you omitted the CPATTERN= option, the procedure uses the pattern specified by the V= option (see below) with each color in the COLORS= list before it uses the next PATTERN statement.
-
REPEAT= n
R= n -
specifies the number of times the PATTERN statement is to be reused. For example, the following statement represents one pattern to be used by SAS/GRAPH software:
pattern1 v=x3 c=red;
You can use the REPEAT= option in the statement to repeat the pattern before going to the next pattern. For example, if you specify the following statements, PATTERN1 is repeated ten times before PATTERN2 is used:
   pattern1 v=x3 c=red  r=10;
   pattern2 v=s  c=blue r=10;
Remember that if you omit the COLOR= option in the PATTERN statement and you do not specify the CPATTERN= option, SAS/GRAPH software repeats the pattern for each color in the current COLORS= list. If you specify the R= option in a PATTERN statement from which the C= option is omitted, the statement cycles through the COLORS= list the number of times given by the value of the R= option.
For example, if the current device has seven colors, then the following statement results in 70 patterns because each group of seven patterns generated by cycling through the COLORS= list is repeated ten times:
pattern v=x3 r=10;
-
VALUE= value
V= value -
specifies the pattern to use for a bar or other area to be filled. The valid values you can use depend on what procedure you are using and the type of graph you are producing.
In a PATTERN statement, if you specify a value for the V= option but not for the C= option, the procedure uses the value you specified for the CPATTERN= option in a GOPTIONS statement. If you omitted the CPATTERN= option, the procedure uses the pattern specified for the V= option with each color in the COLORS= list before it uses the next PATTERN statement. Thus, if you specify the following statements, the PATTERN1 statement is used for the first type of bar, namely, for the duration of a noncritical activity:
   pattern1 c=red   v=x3;
   pattern2         v=s;
   pattern3 c=blue  v=l3;
   pattern4 c=green v=r4;

   proc gantt data=sched;
The PATTERN2 statement is used for the second type of bar, namely, for the slack time of a noncritical activity. Because a C= value is not specified in the PATTERN2 statement, SAS/GRAPH software uses the PATTERN2 statement and cycles through the colors in the COLORS= list for the device to obtain as many patterns as there are colors in the list. If needed, the PATTERN3 and PATTERN4 values are then used for any remaining types of bars.
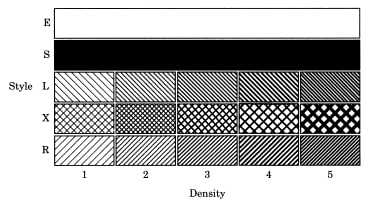
Figure 8.6: Pattern Selection Guide
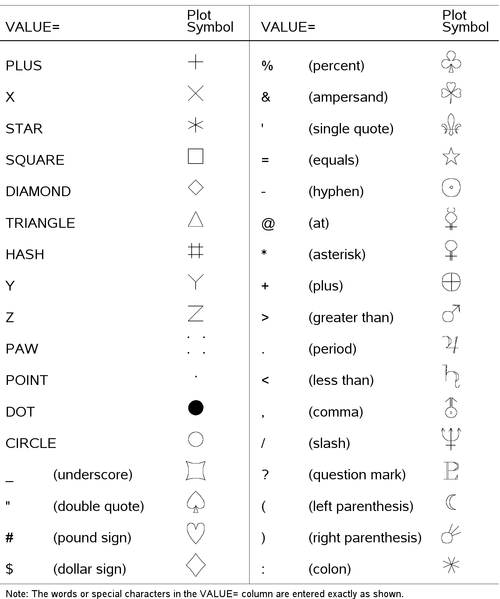
Using SYMBOL Statements
You can specify a SYMBOL statement anywhere in your SAS program. SYMBOL statements give PROC GANTT information about the characters to be used for plotting the CHART variables.
See also the section Special Fonts for Project Management and Decision Analysis for a description of some typically used Gantt chart symbols that can be specified using a SYMBOL statement.
Refer to the SAS/GRAPH documentation for a detailed description of SYMBOL statements. Most of the relevant information is reproduced here for the sake of completeness.
SYMBOL Statement Syntax
The general form of a SYMBOL statement is
SYMBOLn options;
where
-
n is a number ranging from 1 to 255. Each SYMBOL statement remains in effect until you specify another SYMBOL statement ending in the same number. If you do not specify a number following the keyword SYMBOL, SYMBOL1 is assumed.
-
options enables you to specify the plot characters and color.
SYMBOL statements are additive; that is, if you specify a given option in a SYMBOL statement and then omit that option in a later SYMBOL statement ending in the same number, the option remains in effect. To turn off all options specified in previous SYMBOL statements, you can specify all options in a new SYMBOLn statement, use the keyword SYMBOLn followed by a semicolon, or specify a null value. A comma can be used (but is not required) to separate a null parameter from the next option.
For example, both of the following statements cause the C= option to assume its default value (the value of the CSYMBOL= option or the first color in the COLORS= list):
symbol1 c=, v=plus;
and
symbol1 c= v=plus;
In the following statement, both options are reset to their default values:
symbol4 c= v=;
You can also turn off options by specifying the RESET= option in a GOPTIONS statement.
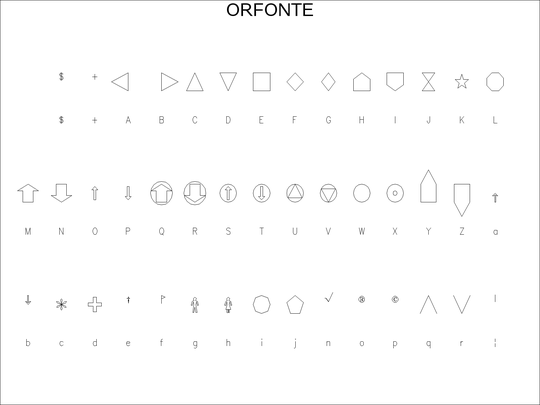
Special Fonts for Project Management and Decision Analysis
Two special marker fonts, ORFONT and ORFONTE, are available in versions 6.08 and later. These two fonts are meant to be used with SAS/OR software and provide a variety of symbols that are typically used in Project Management and Decision Analysis. The fonts ORFONT and ORFONTE are shown in Figure 8.8 and Figure 8.9, respectively. The fonts behave like any SAS/GRAPH font providing you with the capability to control attributes such as color and height.
Figure 8.8: ORFONT - A Filled Font
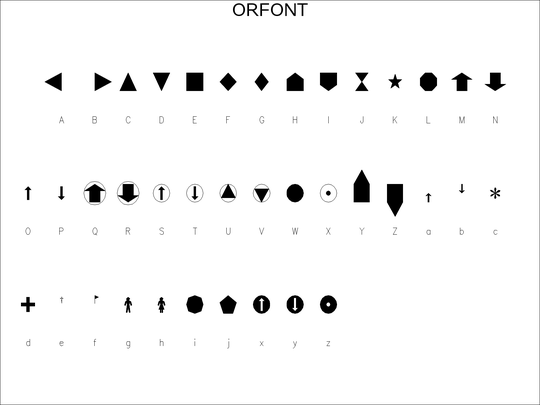
Figure 8.9: ORFONTE - An Empty Font
For example, to use a filled yellow "doghouse" symbol to represent milestones on the Gantt chart, specify the options
VMILE="H" FMILE=ORFONT CMILE=YELLOW
If you wish to represent a CHART variable with an empty blue "circled arrow," then specify the following options in the corresponding SYMBOL statement.
V="Q" F=ORFONTE C=BLUE;