The GANTT Procedure
- Overview
- Getting Started
-
Syntax

-
DetailsSchedule Data SetMissing Values in Input Data SetsSpecifying the PADDING= OptionPage FormatMultiple Calendars and HolidaysFull-Screen VersionGraphics VersionSpecifying the Logic OptionsAutomatic Text AnnotationWeb-Enabled Gantt ChartsMode-Specific DifferencesDisplayed OutputMacro Variable _ORGANTTComputer Resource RequirementsODS Style Templates
-
ExamplesLine-Printer ExamplesPrinting a Gantt ChartCustomizing the Gantt ChartGraphics ExamplesMarking HolidaysMarking Milestones and Special DatesUsing the COMPRESS OptionUsing the MININTERVAL= and SCALE= OptionsUsing the MINDATE= and MAXDATE= OptionsVariable-Length HolidaysMultiple CalendarsPlotting the Actual ScheduleComparing Progress Against a Baseline ScheduleUsing the COMBINE OptionPlotting the Resource-Constrained ScheduleSpecifying the Schedule Data DirectlyBY ProcessingGantt Charts by PersonsUsing the HEIGHT= and HTOFF= OptionsDrawing a Logic Gantt Chart Using AON RepresentationSpecifying the Logic Control OptionsNonstandard Precedence RelationshipsUsing the SAS/GRAPH ANNOTATE= OptionUsing the Automatic Text Annotation FeatureMultiproject Gantt ChartsMultisegment Gantt ChartsZoned Gantt ChartsWeb-Enabled Gantt ChartsUsing the CHARTWIDTH= OptionUsing the TIMEAXISFORMAT= OptionStatement and Option Cross-Reference Tables
- References
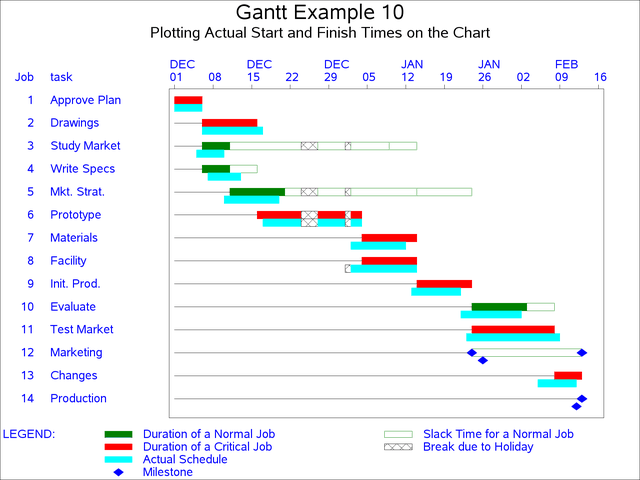
Example 8.10 Plotting the Actual Schedule
Suppose that the project is complete and you want to compare the actual progress of the activities with the predicted schedule
computed by PROC CPM. The following DATA step stores the actual start and finish times of each activity in a data set named
COMPLETE. A data set named WIDGELA is then created that contains both the schedule obtained from PROC CPM (the data set SAVEH from Example 8.3 is used because it does not contain the dummy activity) and the actual schedule. The resulting data set is sorted by early
start time.
Fill patterns are specified using PATTERN statements, and the COMPRESS option is employed in order to draw the entire Gantt chart on one page. Predicted schedules as well as actual schedules are plotted on separate bars for each activity. The A_START= and A_FINISH= options in the CHART statement are used to specify the variables containing the actual start and finish times for each activity. The actual schedule is plotted with the fill pattern specified in the sixth PATTERN statement. This example also illustrates the drawing of holidays in graphics mode. PROC GANTT uses the fill pattern specified in the seventh PATTERN statement to represent the holidays defined by the HOLIDATA= data set. The holidays are identified to PROC GANTT by specifying the HOLIDAY= and HOLIFIN= options in the CHART statement.
The HCONNECT option causes a connecting line to be drawn from the left boundary of the chart to the early start time for each activity. The CHCON= option specifies the color for drawing the connect lines. You can use the LHCON= option in the CHART statement to specify a line style other than the default style for the connect lines. The Gantt chart is shown in Output 8.10.1.
data complete;
   format activity $12. sdate date7. fdate date7.;
   input activity & sdate & date7. fdate & date7.;
   datalines;
Approve Plan   01dec03  05dec03
Drawings       06dec03  16dec03
Study Market   05dec03  09dec03
Write Specs    07dec03  12dec03
Prototype      17dec03  03jan04
Mkt. Strat.    10dec03  19dec03
Materials      02jan04  11jan04
Facility       01jan04  13jan04
Init. Prod.    13jan04  21jan04
Evaluate       22jan04  01feb04
Test Market    23jan04  08feb04
Changes        05feb04  11feb04
Production     12feb04  12feb04
Marketing      26jan04  26jan04
;

 * merge the computed schedule with the actual schedule;
data widgela;
   merge saveh complete;
* sort the data;
proc sort;
   by e_start;
   run;

* set vpos to 40 and hpos to 100;
goptions vpos=40 hpos=100;

title h=1.75 f='Albany AMT' 'Gantt Example 10';
title2 h=1.25
   f='Albany AMT' 'Plotting Actual Start and Finish Times on the Chart';
* plot the computed and actual schedules using proc gantt;
proc gantt graphics data=widgela holidata=holidays;
   chart / holiday=(holiday) holifin=(holifin)
           a_start=sdate a_finish=fdate
           dur=days font='Albany AMT' chcon=black
           hconnect compress ctext=blue height=1.5
           caxis=black cmile=blue;
   id task;
   run;
Output 8.10.1: Plotting the Actual Schedule on the Gantt Chart