The GANTT Procedure
- Overview
- Getting Started
-
Syntax

-
DetailsSchedule Data SetMissing Values in Input Data SetsSpecifying the PADDING= OptionPage FormatMultiple Calendars and HolidaysFull-Screen VersionGraphics VersionSpecifying the Logic OptionsAutomatic Text AnnotationWeb-Enabled Gantt ChartsMode-Specific DifferencesDisplayed OutputMacro Variable _ORGANTTComputer Resource RequirementsODS Style Templates
-
ExamplesLine-Printer ExamplesPrinting a Gantt ChartCustomizing the Gantt ChartGraphics ExamplesMarking HolidaysMarking Milestones and Special DatesUsing the COMPRESS OptionUsing the MININTERVAL= and SCALE= OptionsUsing the MINDATE= and MAXDATE= OptionsVariable-Length HolidaysMultiple CalendarsPlotting the Actual ScheduleComparing Progress Against a Baseline ScheduleUsing the COMBINE OptionPlotting the Resource-Constrained ScheduleSpecifying the Schedule Data DirectlyBY ProcessingGantt Charts by PersonsUsing the HEIGHT= and HTOFF= OptionsDrawing a Logic Gantt Chart Using AON RepresentationSpecifying the Logic Control OptionsNonstandard Precedence RelationshipsUsing the SAS/GRAPH ANNOTATE= OptionUsing the Automatic Text Annotation FeatureMultiproject Gantt ChartsMultisegment Gantt ChartsZoned Gantt ChartsWeb-Enabled Gantt ChartsUsing the CHARTWIDTH= OptionUsing the TIMEAXISFORMAT= OptionStatement and Option Cross-Reference Tables
- References
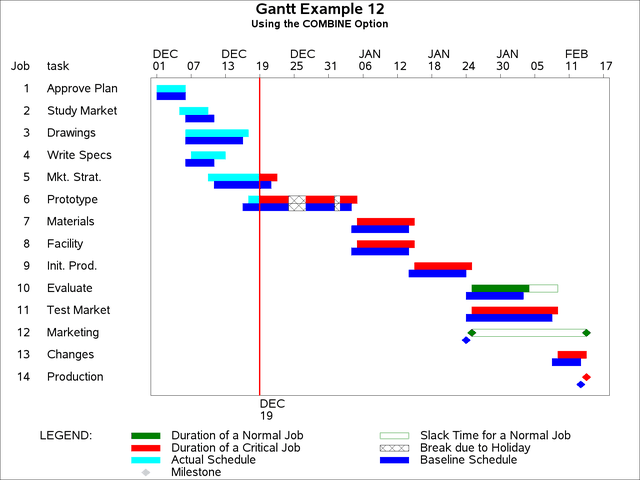
Example 8.12 Using the COMBINE Option
When you monitor a project in progress, as in the previous example, it is evident that there are no actual dates beyond TIMENOW and that PROC CPM sets the early times to the corresponding actual times for activities that are completed or in progress (see Output 8.11.1). For example, activities 1 through 4 have their early schedule equal to the actual schedule. Activities 5 and 6 have their early start equal to the actual start; however the actual finish for these two activities is missing since they are in progress at TIMENOW. Finally, activities 7 through 14 have no actual information.
The COMBINE option in PROC GANTT exploits the fact that the early times are made consistent with the actual times to strip away a lot of the redundancy and produce a more compact Gantt chart while retaining all of the essential schedule information. Specifying the COMBINE option in the CHART statement of the previous example produces the Gantt chart in Output 8.12.1. Instead of using two separate bars to draw the early/late schedule and the actual schedule, the COMBINE option causes PROC GANTT to use one bar to represent all three schedules and draws a timenow line. The actual schedule is shown to the left of TIMENOW and the early/late schedule is shown to the right of TIMENOW. Thus, for activities 1 through 4, the actual schedule is drawn on the first bar to the left of the timenow line. Activities 5 and 6 are in progress at TIMENOW, which is indicated by the actual start positioned to the left of TIMENOW and the predicted early/late schedule, based on the progress made up to TIMENOW, drawn to the right of TIMENOW. Activities 7 through 14 have not yet started, and this is reflected in their predicted early/late schedules drawn to the right of TIMENOW.
The COMBINE option draws a timenow line by default, and if the TIMENOW= option is not specified, the procedure computes the value of TIMENOW based on the schedule data as explained in the "Syntax" section. In this example, specifying the COMBINE option without the TIMENOW= option causes a timenow line to be drawn on December 18, 2003, since this is the first day following the largest actual value. The CTNOW= option is used to specify the color of the timenow line. You can change the line style and line width of the timenow line by specifying the LTNOW= and WTNOW= options, respectively, in the CHART statement.
title h=1.6 'Gantt Example 12';
title2 'Using the COMBINE Option';

* set vpos to 50 and hpos to 100;
goptions vpos=50 hpos=100;

* plot the combined and baseline schedules using proc gantt;
proc gantt graphics data=widgupdt holidata=holidays;
   chart / holiday=(holiday) holifin=(holifin)
           compress ctnow=red caxis=black
           height=1.5
           timenow='19dec03'd
           dur=days
           combine;
   id task;
   run;
Output 8.12.1: Using the COMBINE Option in Graphics Mode