The NETDRAW Procedure
- Overview
- Getting Started
-
Syntax

-
DetailsNetwork Input Data SetVariables in the Network Data SetMissing ValuesLayout of the NetworkFormat of the DisplayPage FormatLayout Data SetControlling the LayoutTime-Scaled Network DiagramsZoned Network DiagramsOrganizational Charts or Tree DiagramsFull-Screen VersionGraphics VersionUsing the Annotate FacilityWeb-Enabled Network DiagramsMacro Variable _ORNETDRComputer Resource RequirementsODS Style Templates
-
ExamplesLine-Printer Network DiagramGraphics Version of PROC NETDRAWSpanning Multiple PagesThe COMPRESS and PCOMPRESS OptionsControlling the Display FormatNonstandard Precedence RelationshipsControlling the Arc-Routing AlgorithmPATTERN and SHOWSTATUS OptionsTime-Scaled Network DiagramFurther Time-Scale OptionsZoned Network DiagramSchematic DiagramsModifying Network LayoutSpecifying Node PositionsOrganizational Charts with PROC NETDRAWAnnotate Facility with PROC NETDRAWAOA Network Using the Annotate FacilityBranch and Bound TreesStatement and Option Cross-Reference Tables
- References
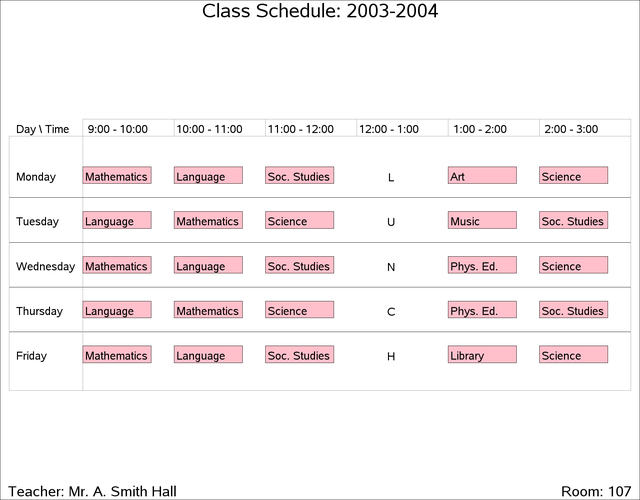
Example 9.16 Annotate Facility with PROC NETDRAW
This example demonstrates the use of PROC NETDRAW for a nonstandard application. The procedure is used to draw a time table
for a class of students. The days of the week are treated as different zones, and the times within a day are treated as different
values of an alignment variable. The following DATA step defines a total of twenty activities, 'm1', …,'f5', which refer to
the five different periods for the five different days of the week. The variable class contains the name of the subject taught in the corresponding period and day. Note that the periods are taught during the
hours 1, 2, 3, 5, and 6; the fourth hour is set aside for lunch. The time axis is labeled with the format CLASSTIM, which
is defined using PROC FORMAT. The USEFORMAT option in the ACTNET statement instructs PROC NETDRAW to use the explicit format
specified for the time variable rather than the default format.
This example also illustrates the use of the Annotate facility with PROC NETDRAW. The data set ANNO labels the fourth period 'LUNCH.' The positions for the text are specified using data coordinates that refer to the (_X_, _Y_) grid used by PROC NETDRAW. Thus, for example X = '4' identifies the x coordinate for the annotated text to be the fourth period, and the y coordinates are set appropriately. The resulting time table is shown in Output 9.16.1.
 /* Define format for the ALIGN= variable */
proc format;
   value classtim 1 = ' 9:00 - 10:00'
                  2 = '10:00 - 11:00'
                  3 = '11:00 - 12:00'
                  4 = '12:00 - 1:00 '
                  5 = ' 1:00 - 2:00 '
                  6 = ' 2:00 - 3:00 ';
   run;
data schedule;
   format day $9. class $12. ;
   input day $ class &  time daytime $ msucc $;
   format time classtim.;
   label day = "Day \ Time";
   datalines;
Monday     Mathematics    1   m1   .
Monday     Language       2   m2   .
Monday     Soc. Studies   3   m3   .
Monday     Art            5   m4   .
Monday     Science        6   m5   .
Tuesday    Language       1   t1   .
Tuesday    Mathematics    2   t2   .
Tuesday    Science        3   t3   .
Tuesday    Music          5   t4   .
Tuesday    Soc. Studies   6   t5   .
Wednesday  Mathematics    1   w1   .
Wednesday  Language       2   w2   .
Wednesday  Soc. Studies   3   w3   .
Wednesday  Phys. Ed.      5   w4   .
Wednesday  Science        6   w5   .
Thursday   Language       1   th1  .
Thursday   Mathematics    2   th2  .
Thursday   Science        3   th3  .
Thursday   Phys. Ed.      5   th4  .
Thursday   Soc. Studies   6   th5  .
Friday     Mathematics    1   f1   .
Friday     Language       2   f2   .
Friday     Soc. Studies   3   f3   .
Friday     Library        5   f4   .
Friday     Science        6   f5   .
;
data anno;
   /* Set up required variable lengths, etc. */
   length function color style   $8;
   length xsys ysys hsys         $1;
   length when position          $1;

   xsys     = '2';
   ysys     = '2';
   hsys     = '4';
   when     = 'a';

   function = 'label   ';
   x = 4;
   size = 2;
   position = '5';
   y=5; TEXT='L'; output;
   y=4; TEXT='U'; output;
   y=3; TEXT='N'; output;
   y=2; TEXT='C'; output;
   y=1; TEXT='H'; output;
   run;
pattern1 v=s c=pink;
title 'Class Schedule: 2003-2004';
footnote j=l h=2 '  Teacher: Mr. A. Smith Hall'
         j=r h=2 'Room: 107  ';
proc netdraw graphics data=schedule anno=anno;
   actnet / act=daytime
            succ=msucc
            id=(class)
            nodefid nolabel
            zone=day
            align=time
            useformat
            linear
            pcompress
            coutline=black
            hmargin = 2 vmargin = 2
            htext=2;
   run;
Output 9.16.1: Use of the Annotate Facility