The NETDRAW Procedure
- Overview
- Getting Started
-
Syntax

-
DetailsNetwork Input Data SetVariables in the Network Data SetMissing ValuesLayout of the NetworkFormat of the DisplayPage FormatLayout Data SetControlling the LayoutTime-Scaled Network DiagramsZoned Network DiagramsOrganizational Charts or Tree DiagramsFull-Screen VersionGraphics VersionUsing the Annotate FacilityWeb-Enabled Network DiagramsMacro Variable _ORNETDRComputer Resource RequirementsODS Style Templates
-
ExamplesLine-Printer Network DiagramGraphics Version of PROC NETDRAWSpanning Multiple PagesThe COMPRESS and PCOMPRESS OptionsControlling the Display FormatNonstandard Precedence RelationshipsControlling the Arc-Routing AlgorithmPATTERN and SHOWSTATUS OptionsTime-Scaled Network DiagramFurther Time-Scale OptionsZoned Network DiagramSchematic DiagramsModifying Network LayoutSpecifying Node PositionsOrganizational Charts with PROC NETDRAWAnnotate Facility with PROC NETDRAWAOA Network Using the Annotate FacilityBranch and Bound TreesStatement and Option Cross-Reference Tables
- References
Example 9.11 Zoned Network Diagram
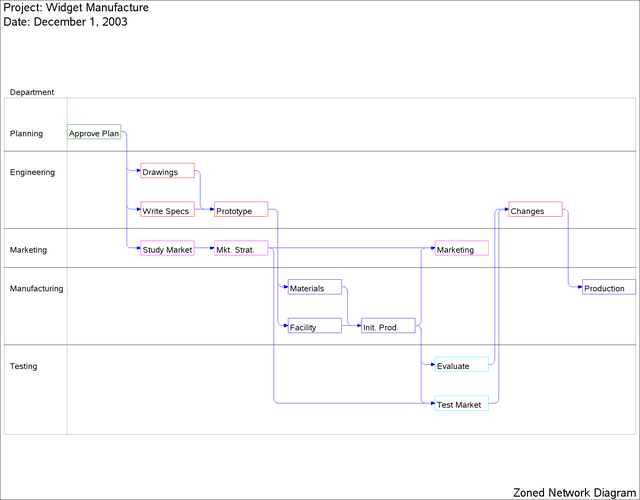
This example illustrates zoned network diagrams. The Widget Manufacturing project is used to illustrate some aspects of this
feature. The data set DETAILS contains a variable phase, which identifies the phase of each activity in the project. This data set is merged with the Activity data set from Example 9.1, WIDGET, to produce the data set NETWORK that is input to PROC NETDRAW. The ZONE= option divides the network diagram into horizontal
zones based on the project phase. The ZONEPAT option causes the activities in each zone to be drawn using a different pattern.
The resulting network diagram is shown in Output 9.11.1.
data details;
   format task $12. phase $13. descrpt $30. ;
   input task & phase $ descrpt & ;
   datalines;
Approve Plan  Planning       Develop Concept
Drawings      Engineering    Prepare Drawings
Study Market  Marketing      Analyze Potential Markets
Write Specs   Engineering    Write Specifications
Prototype     Engineering    Build Prototype
Mkt. Strat.   Marketing      Develop Marketing Concept
Materials     Manufacturing  Procure Raw Materials
Facility      Manufacturing  Prepare Manufacturing Facility
Init. Prod.   Manufacturing  Initial Production Run
Evaluate      Testing        Evaluate Product In-House
Test Market   Testing        Test Product in Sample Market
Changes       Engineering    Engineering Changes
Production    Manufacturing  Begin Full Scale Production
Marketing     Marketing      Begin Full Scale Marketing
;
data network;
   merge widget details;
   run;
pattern1 v=e c=green;
pattern2 v=e c=red;
pattern3 v=e c=magenta;
pattern4 v=e c=blue;
pattern5 v=e c=cyan;

title  j=l h=1.5 ' Project: Widget Manufacture';
title2 j=l h=1.5 ' Date: December 1, 2003';
footnote j=r h=1.5 'Zoned Network Diagram ';


proc netdraw data=network graphics;
   actnet / act=task succ=(succ1 succ2 succ3)
            separatearcs
            zone=phase
            zonepat
            pcompress
            htext=2;
   label phase = 'Department';
   run;
Output 9.11.1: Zoned Network Diagram
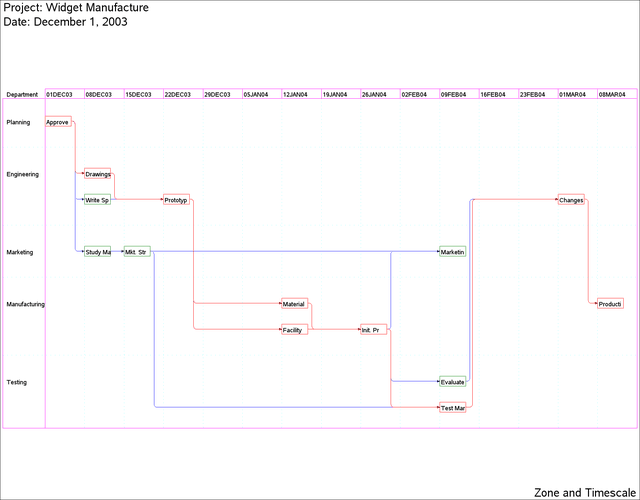
Next, the project is scheduled with PROC CPM, and PROC NETDRAW is invoked with the ZONE= and TIMESCALE options. The nodes
are placed in different zones as dictated by the ZONE variable, phase, and are aligned along the time axis as dictated by the default ALIGN variable, E_START. The MININTERVAL= option produces one tick mark per week for the duration of the project. The LREF= option identifies the
linestyle of the reference lines and the dividing lines between zones. The nodes are colored red or green according to whether
or not the corresponding activities are critical (PATTERN statements 1 and 2 from the previous invocation of PROC NETDRAW
are still valid).
proc cpm data=network interval=weekday
         out=sched date='1dec03'd;
   activity task;
   succ     succ1 succ2 succ3;
   duration days;
   id phase;
   run;

title  j=l h=1.5 ' Project: Widget Manufacture';
title2 j=l h=1.5 ' Date: December 1, 2003';
footnote j=r h=1.5 'Zone and Timescale ';
proc netdraw data=sched graphics;
   actnet / act=task succ=(succ1 succ2 succ3)
            pcompress
            carcs = blue ccritarcs=red
            cref = cyan
            caxis = magenta
            lref = 33
            id = (task)
            nodefid
            nolabel
            boxwidth = 8
            htext=2
            separatearcs
            timescale
            mininterval=week
            autoref
            linear
            zone=phase
            zonespace;
   label phase = 'Department';
   run;
Output 9.11.2: Zoned Network Diagram with Time Axis