Introduction to Classification Panels
Classification Panels in the GTL
A classification panel
is a graph with one or more cells in which each cell shows a common
graph (called a prototype). The prototypes that are displayed in the
cells result from dividing input data into subsets that are determined
by the values of one or more classification variables. GTL provides
two layouts that can produce classification panels:
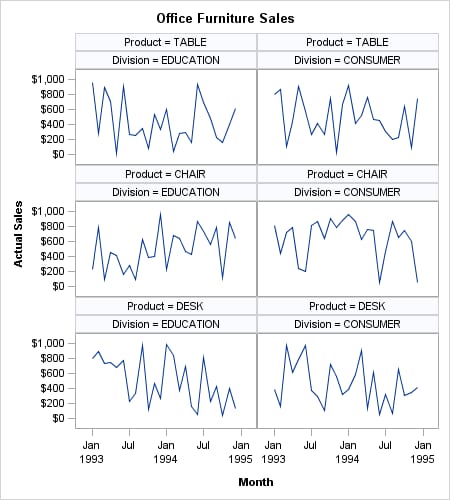
The LAYOUT DATAPANEL Statement
The example in this
section uses the LAYOUT DATAPANEL statement to specify a list of two
classification variables: DIVISION (two distinct values) and PRODUCT
(three distinct values). Six combinations (crossings) of these unique
values are possible, which produces a panel with six cells.
The following template
code generates Classification Panel Created with LAYOUT DATAPANEL.
proc template;
 define statgraph datapanel_intro;
  begingraph;
    entrytitle "Office Furniture Sales";
    layout datapanel classvars=(product division) / columns=2;
      layout prototype;
        seriesplot x=month y=actual;
      endlayout;
    endlayout;
  endgraph;
 end;
run;
In the template code,
notice the LAYOUT PROTOTYPE block, which is inside the LAYOUT DATAPANEL
block. This nested block, a required part of the DATAPANEL layout,
defines the graphical content of all of the cells. The COLUMNS=2
setting forces a DATAPANEL layout to display the cells in a two-column
organization. The actual number of rows that are generated depends
on the number of crossings that are in the data.
For some data, the number
of data crossings can be quite large. Thus, when rendering the graph
for a classification panel, it is common to use a WHERE expression
to limit the number of crossings:
proc sgrender data=sashelp.prdsale template=datapanel_intro;
  where country="U.S.A." and region="EAST" and
        product in ("CHAIR" "DESK" "TABLE") ;
  format actual dollar.;
run;
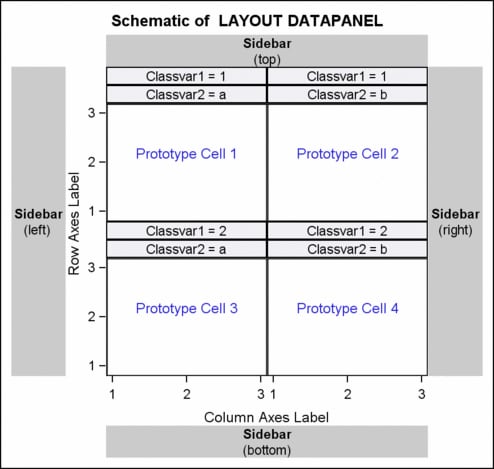
The following schematic
shows the general organization of a graph that is produced with the
DATAPANEL layout. If the template code does not use the sidebar areas
that are shown in the schematic, that space is reclaimed in the graph.
Also, the order in which you specify the classification variables
affects the cell ordering. The graph that is represented by the schematic
could be produced with
CLASSVARS=(classvar1 classvar2).
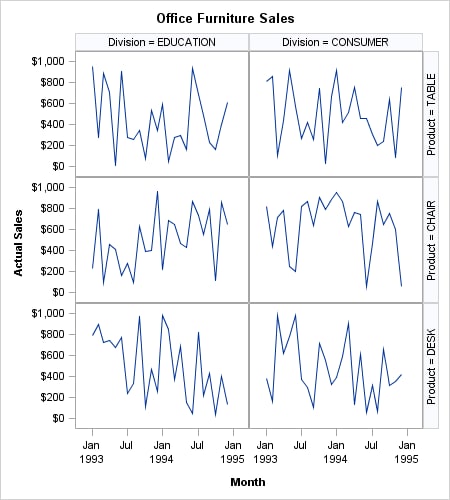
The LAYOUT DATALATTICE Statement
The example in this
section uses the LAYOUT DATALATTICE statement to specify the same
two classification variables: DIVISION and PRODUCT. Notice the following
details about the LAYOUT DATALATTICE statement:
The following template
code generates Classification Panel Created with LAYOUT DATALATTICE.
proc template;
define statgraph datalattice_intro;
  begingraph;
    entrytitle "Office Furniture Sales";
    layout datalattice rowvar=product columnvar=division;
      layout prototype;
        seriesplot x=month y=actual;
      endlayout;
    endlayout;
  endgraph;
end;
run;

proc sgrender data=sashelp.prdsale template=datalattice_intro;
  where country="U.S.A." and region="EAST" and
        product in ("CHAIR" "DESK" "TABLE");
  format actual dollar.;
run;
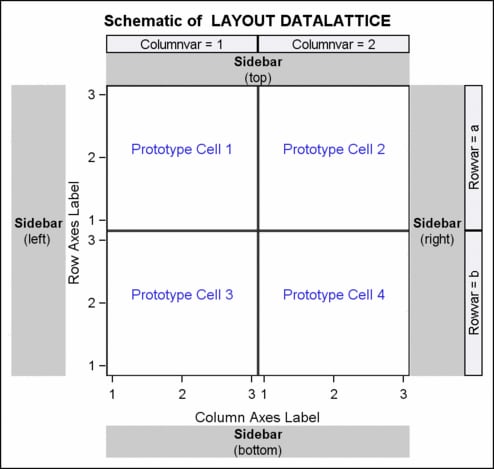
In this example, the
grid dimensions are automatically determined by the number of distinct
values of the classifiers PRODUCT and DIVISION.
Coding Distinction Between DATAPANEL and DATALATTICE
The primary difference between coding the DATAPANEL and DATALATTICE
layouts is the way that the classification variables are declared.
DATAPANEL takes one
list of variables in parentheses. The number of class variables in
the list is unlimited, though the effectiveness of the graph decreases
as the number of class variables exceeds three or four. In such a
case, it is better to use two class variables, and use the other class
variables in the BY statement of the SGRENDER procedure.
layout datapanel classvars=(product division) / . . . ;
DATALATTICE, on the other hand, takes one variable
for a row dimension and/or one variable for a column dimension:layout datalattice rowvar=product colvar=division / . . .;The LAYOUT PROTOTYPE Statement
In both the DATAPANEL
and the DATALATTICE blocks, the nested PROTOTYPE layout is similar
to an OVERLAY layout, with the following major differences:
-
Multiple plots can be overlaid, but BARCHART is the only computed plot that can be included in the prototype. This means that you cannot use BOXPLOT, DENSITYPLOT, ELLIPSE, HISTOGRAM, REGRESSIONPLOT, LOESSPLOT, PBSPLINE, or MODELBAND statements in the PROTOTYPE layout. See Using Non-computed Plots in Classification Panels for examples of how to work around this limitation.
-
DISCRETELEGEND, CONTINUOUSLEGEND, ENTRY, ENTRYTITLE, and ENTRYFOOTNOTE statements cannot be included in the PROTOTYPE layout, nor can nested layouts. For information about adding a legend or other information outside of the cells, see Using Sidebars.
-
Axis options for classification panels are specified on the LAYOUT DATALATTICE or LAYOUT DATAPANEL statement, not on the LAYOUT PROTOTYPE statement. For information about setting axis options for the layout, see Setting Panel Axis Features.