SGSCATTER Procedure
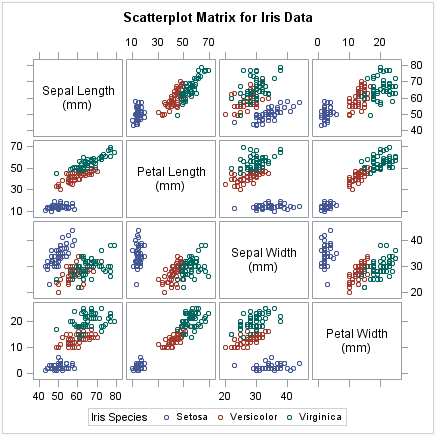
Example 1: Creating a Scatter Plot Matrix
| Features: |
MATRIX statement
GROUP option
|
| Sample library member: |
SGSCMAT |
This example shows a
scatter plot matrix with grouped data.
Program
proc sgscatter data=sashelp.iris;
  title "Scatterplot Matrix for Iris Data";
  matrix sepallength petallength sepalwidth petalwidth
         / group=species;
run;
title;
Program Description
Set the title and footnote and create the scatter plot
matrix. In the MATRIX statement, the
GROUP = option groups the data by the SPECIES variable.
proc sgscatter data=sashelp.iris;
  title "Scatterplot Matrix for Iris Data";
  matrix sepallength petallength sepalwidth petalwidth
         / group=species;
run;
title;
Copyright © SAS Institute Inc. All rights reserved.

