SGSCATTER Procedure

Example 2: Creating a Graph with Multiple Independent Scatter Plots and Spline Curves
| Features: |
PLOT statement PBSPLINE option |
| Sample library member: | SGSCPLT |
Program
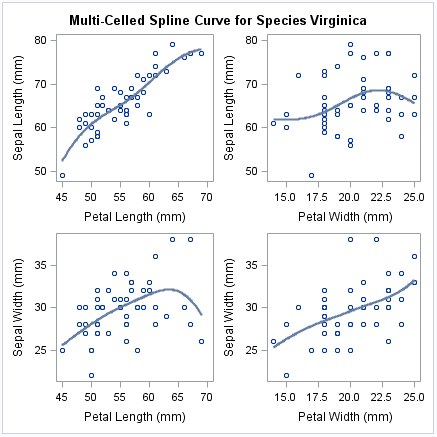
proc sgscatter data=sashelp.iris(where=(species="Virginica"));
  title "Multi-Celled Spline Curve for Species Virginica";
  plot (sepallength sepalwidth)*(petallength petalwidth)
       / pbspline;
run;
title;