SGSCATTER Procedure
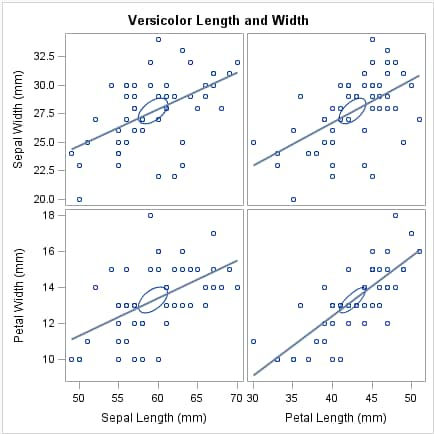
Example 4: Creating a Comparative Panel with Regression Fits and Confidence Ellipses
| Features: |
COMPARE statement REG option ELLIPSE option SPACING option |
| Sample library member: | SGSCCM1 |
This example shows a
comparative panel of scatter plots with regression fits and confidence
ellipses.
Program
proc sgscatter data=sashelp.iris(where=(species="Versicolor"));
  title "Versicolor Length and Width";
  compare y=(sepalwidth petalwidth)
          x=(sepallength petallength)
          / reg ellipse=(type=mean) spacing=4;
run;
title;
