SGPANEL Procedure
- Syntax
 Procedure SyntaxPROC SGPANEL StatementPANELBY StatementBAND StatementBUBBLE StatementDENSITY StatementDOT StatementHBAR StatementHBARPARM StatementHBOX StatementHIGHLOW StatementHISTOGRAM StatementHLINE StatementKEYLEGEND StatementLINEPARM StatementLOESS StatementNEEDLE StatementPBSPLINE StatementREFLINE StatementREG StatementSCATTER StatementSERIES StatementSTEP StatementVBAR StatementVBARPARM StatementVBOX StatementVECTOR StatementVLINE StatementCOLAXIS StatementROWAXIS Statement
 - Overview
- Concepts
- Examples
DENSITY Statement
Creates a density curve that shows the distribution
of values in your data.
| Interaction: | The DENSITY statement can be combined only with the DENSITY and HISTOGRAM statements in the SGPANEL procedure. |
| Examples: | About Density Plots Creating a Panel of Graph Cells with Histograms and Density Plots |
Syntax
DENSITY response-variable < /
option(s)>;
Summary of Optional Arguments
DENSITY options
specifies the appearance of the density line.
specifies the scaling that is used for the response
axis.
specifies the type of distribution curve that is
used for the density plot.
Plot options
specifies how many times observations are repeated
for computational purposes.
specifies a label that identifies the density plot
in the legend.
specifies a name for the plot.
specifies the degree of transparency for the density
curve.
Optional Arguments
- FREQ= numeric-variable
- specifies how many times observations are repeated for computational purposes. Each observation is repeated n times for computational purposes, where n is the value of the numeric variable. If n is not an integer, then it is truncated to an integer. If n is less than 1 or missing, then it is excluded from the analysis.
- LEGENDLABEL= “text-string”
- specifies a label that identifies the density plot
in the legend. By default, the label
identifies the type of density curve. If you specify TYPE=NORMAL,
then the default label is “Normal.” If you specify TYPE=KERNEL,
then the default label is “Kernel.”Note:User-specified parameters from the TYPE= option are included in the label by default.
- LINEATTRS= style-element <(options)> | (options)
- specifies the appearance of the density line. You can specify the
appearance by using a style element or by using suboptions. If you
specify a style element, you can also specify suboptions to override
specific appearance attributes.
- COLOR= color
-
specifies the color of the line. You can specify colors using the same color schemes that are supported by
SAS/GRAPH software. For more information, see Color-Naming Schemes in SAS/GRAPH: Reference.Default:The default color is specified by the ContrastColor attribute of the GraphFit style element in the current style.
- PATTERN= line-pattern
-
specifies the line pattern for the line. You can reference SAS patterns by number or by name. For a list of line patterns, see Line Patterns.Default:The default line pattern is specified by the LineStyle attribute of the GraphFit style element in the current style.
- THICKNESS= n <units>
-
specifies the thickness of the line. You can also specify the unit of measure. The default unit is pixels. For a list of measurement units that are supported, see Units of Measurement.Default:The default line thickness is specified by the LineThickness attribute of the GraphFit style element in the current style.
- NAME= “text-string”
- specifies a name for the plot. You can use the name
to refer to this plot in other statements.Note:The name is case-sensitive. When you refer to the specified name in other statements, you must use the same exact capitalization.
- SCALE= COUNT | DENSITY | PERCENT | PROPORTION
- specifies the scaling that is used for the response
axis. Specify one of the
following values:
Default:PERCENT
- TRANSPARENCY= numeric-value
- specifies the degree of transparency for the density
curve. Specify a value from
0.0 (completely opaque) to 1.0 (completely transparent).Default:0.0
- TYPE = NORMAL < (normal-opts)>| KERNEL < (kernel-opts)>
- specifies the type of distribution curve that is
used for the density plot. Specify one of the
following keywords:
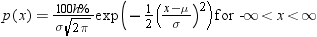
- NORMAL < (normal-opts)>
-
specifies a normal density estimate, with a mean and a standard deviation.
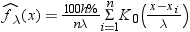
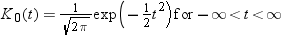
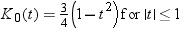
- KERNEL < (kernel-opts)>
-
specifies a nonparametric kernel density estimate.
Default:NORMAL