SGPANEL Procedure
- Syntax
 Procedure SyntaxPROC SGPANEL StatementPANELBY StatementBAND StatementBUBBLE StatementDENSITY StatementDOT StatementHBAR StatementHBARPARM StatementHBOX StatementHIGHLOW StatementHISTOGRAM StatementHLINE StatementKEYLEGEND StatementLINEPARM StatementLOESS StatementNEEDLE StatementPBSPLINE StatementREFLINE StatementREG StatementSCATTER StatementSERIES StatementSTEP StatementVBAR StatementVBARPARM StatementVBOX StatementVECTOR StatementVLINE StatementCOLAXIS StatementROWAXIS Statement
 - Overview
- Concepts
- Examples
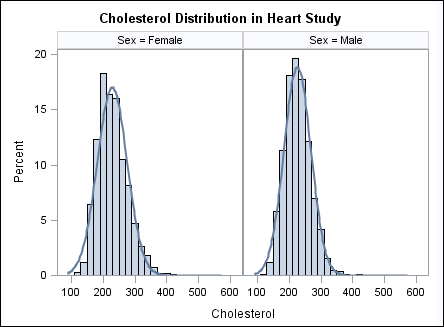
Example 1: Creating a Panel of Graph Cells with Histograms and Density Plots
| Features: |
HISTOGRAM statement DENSITY statement |
| Sample library member: | SGPNHST |