GPROJECT Procedure

Example 4: Projecting an Annotate Data Set
| Features: |
PROC GPROJECT options DATA=, OUT=, PARMENTRY=, PARMOUT= ID statement |
| Other features: |
CHORO statement and Annotate data set |
| Sample library member: | GPJANNOT |
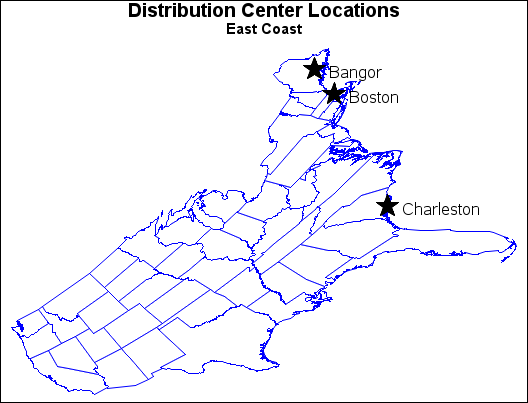
This example illustrates
how to project an Annotate data set for use with a map data set.
It labels the locations of Charleston, Boston, and Bangor on the map
shown in the second example. Because the X and Y variables in the
USCITY data set already have been projected to match the US data set,
they cannot be used with the map that is produced by the second example.
To properly label the projected map, the example uses the same projection
method for the city coordinates that is used for the map coordinates.
This example illustrates how to use the same projection method for
both data sets.
Program
goptions reset=all border;
data us48;
   set maps.states;
   if state ne 2 and state ne 15 and state ne 72;
   if density<4;
run;
proc gproject data=us48
              out=us48p
              project=gnomon
              polelong=160
              polelat=45
              parmout;
id state;
run;
data cities;
   set maps.uscity(keep=lat long city state);
   length function style color $ 10
          position $ 1 text $ 20;
   retain function "label" xsys ysys "2"
          hsys "1" when "a";
   if (state=45 and city="Charleston") or
      (state=25 and city="Boston") or
      (state=23 and city="Bangor");
    state+100; color="black"; size=8; text="V";
      position="5";
      style="marker"; x=long;
      y=lat; output;
    state+1; color="black"; size=5;
      text="   "||city;
      position="6"; style="Albany AMT"; output;
run;
proc gproject data=cities
              degrees
              out=citiesp
              parmentry=us48p
              dupok;
   id;
run;
title1 "Distribution Center Locations";
title2 "East Coast";
pattern value=solid color=white;
proc gmap data=us48p map=us48p all;
   id state;
   choro state
         / nolegend levels=1 coutline=blue
           annotate=citiesp;
run;
quit;
Program Description
Project the US48 data set.The
DATA= option specifies the data set to be projected. The OUT= option
specifies the name of the new projected data set that is created.
The PARMOUT creates the projection parameters data set. The ID statement
identifies the variable in the input map data set that defines map
areas.
Create the Annotate data set CITIES from the MAPS.USCITY
data set. The unprojected LONG and LAT
variable values are substituted for the projected X and Y variable
values. The value of STATE is modified for each label to ensure that
it is unique.
data cities;
   set maps.uscity(keep=lat long city state);
   length function style color $ 10
          position $ 1 text $ 20;
   retain function "label" xsys ysys "2"
          hsys "1" when "a";
   if (state=45 and city="Charleston") or
      (state=25 and city="Boston") or
      (state=23 and city="Bangor");
    state+100; color="black"; size=8; text="V";
      position="5";
      style="marker"; x=long;
      y=lat; output;
    state+1; color="black"; size=5;
      text="   "||city;
      position="6"; style="Albany AMT"; output;
run;
Project the annotate data set. The
DATA= option specifies the data set to be projected. The OUT= option
specifies the name of the new projected data set that is created.
The DEGREES option specifies that the coordinates are in degrees rather
than radians. The PARMENTRY= option specifies the entry in the projection
parameters data set that is used. The empty ID statement specifies
that the data is not polygonal. Note that the PARMIN= option is not
needed because the WORK.PROJPARM data set is used by default.