The PANEL Procedure
- Overview
-
Getting Started

-
Syntax
-
Details
Missing Values Computational Resources Restricted Estimates Notation The One-Way Fixed-Effects Model The Two-Way Fixed-Effects Model Balanced Panels Unbalanced Panels Between Estimators Pooled Estimator The One-Way Random-Effects Model The Two-Way Random-Effects Model Parks Method (Autoregressive Model) Da Silva Method (Variance-Component Moving Average Model) Dynamic Panel Estimator Linear Hypothesis Testing Heteroscedasticity-Corrected Covariance Matrices R Square Specification Tests Troubleshooting ODS Graphics The OUTPUT OUT= Data Set The OUTEST= Data Set The OUTTRANS= Data Set Printed Output ODS Table Names
-
Examples
- References
| ODS Graphics Plots |
ODS graphics plots can be obtained to graphically analyze the results. The following statements show how to generate the plots. If the PLOTS=ALL option is specified, all available plots are produced in two panels. For a complete list of options, see the section ODS Graphics.
proc panel data=airline;
   id i t;
   model lC = lQ lPF LF / fixtwo plots = all;
run;
The preceding statements result in plots shown in Output 20.2.5 and Output 20.2.6.
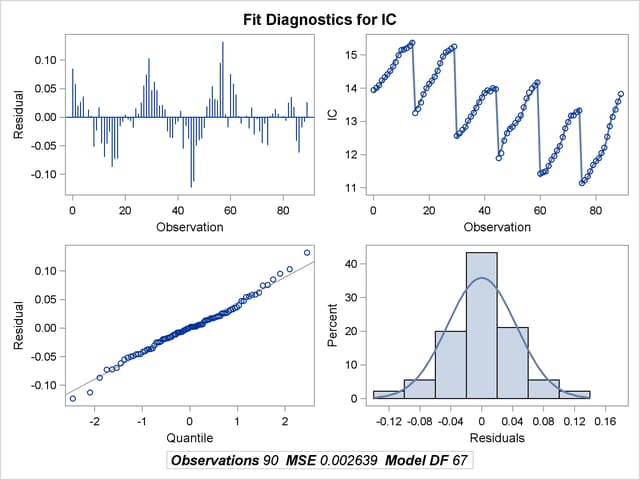
Output 20.2.5
Diagnostic Panel 1
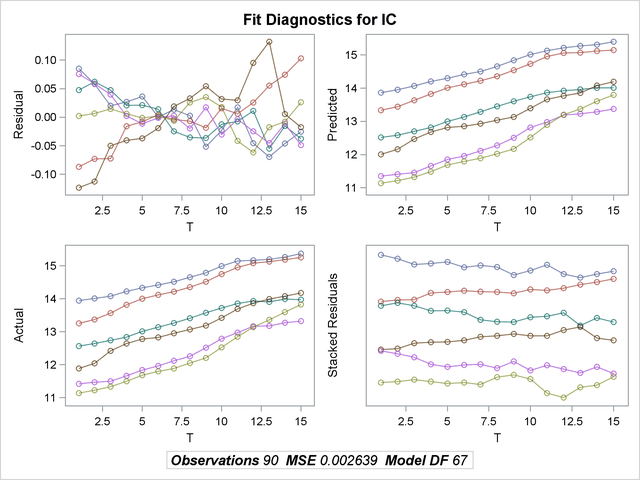
Output 20.2.6
Diagnostic Panel 2
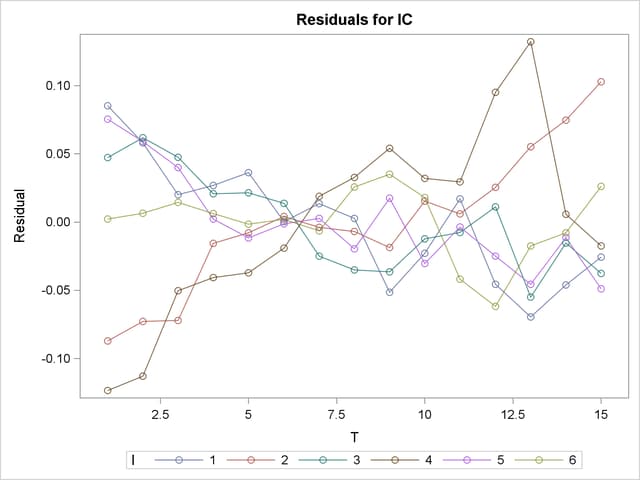
The UNPACK and ONLY options produce individual detail images of paneled plots. The graph shown in Output 20.2.7 shows a detail plot of residuals by cross section. The packed version always puts all cross sections on one plot while the unpacked one shows the cross sections in groups of ten to avoid loss of detail.
proc panel data=airline;
   id i t;
   model lC = lQ lPF LF / fixtwo plots(unpack only) = residsurface;
run;
Output 20.2.7
Surface Plot of the Residual