Graphics Samples Output Gallery
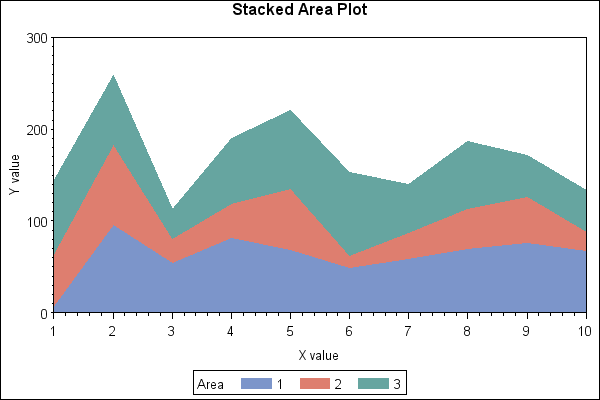
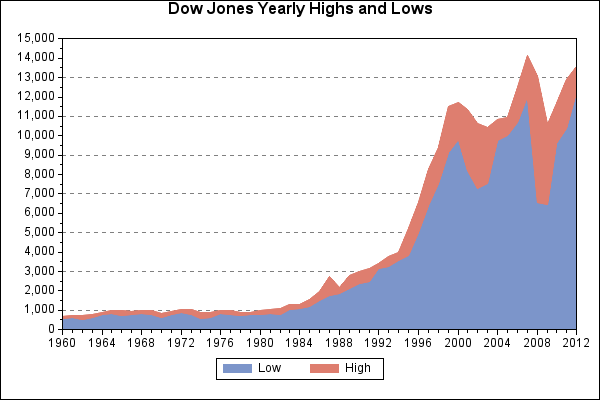
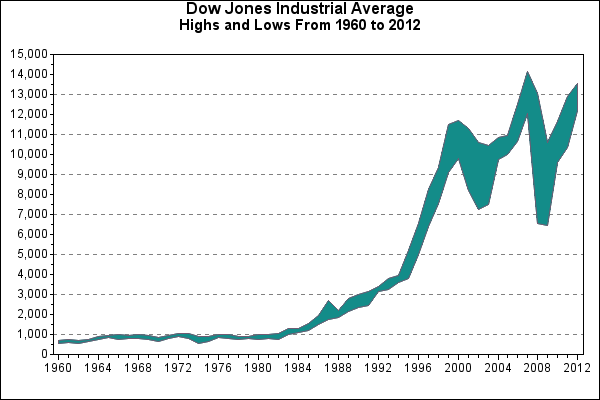
Click on the About tab within each sample for product and release requirements.Sample 25596 - Fill the area between plot lines using a SYMBOL statement with PROC GPLOT [ View Code ]
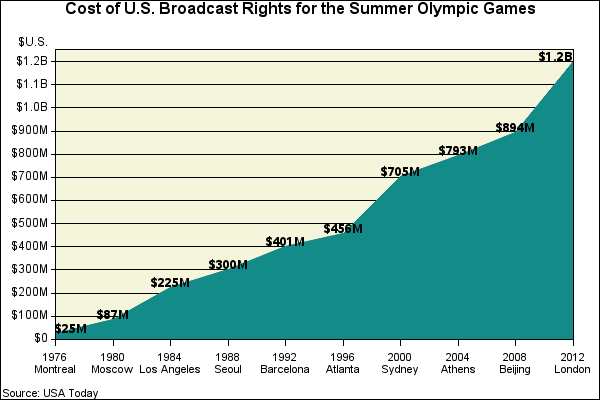
Sample 24920 - Label data points in a two-dimensional plot using PROC GPLOT and Annotate[ View Code ]
