The HPLOGISTIC Procedure
-
Overview

-
Getting Started
-
Syntax
-
DetailsMissing ValuesResponse DistributionsLog-Likelihood FunctionsExistence of Maximum Likelihood EstimatesUsing Validation and Test DataModel Fit and Assessment StatisticsThe Hosmer-Lemeshow Goodness-of-Fit TestComputational Method: MultithreadingChoosing an Optimization AlgorithmDisplayed OutputODS Table Names
-
Examples
- References
The Hosmer-Lemeshow Goodness-of-Fit Test
To evaluate the fit of the model, Hosmer and Lemeshow (2000) proposed a statistic that they show, through simulation, is distributed as chi-square when there is no replication in any of the subpopulations. This goodness-of-fit test is available only for binary response models.
The unit interval is partitioned into 2,000 equal-sized bins, and each observation i is placed into the bin that contains its estimated event probability. This effectively sorts the observations in increasing order of their estimated event probability.
The observations (and frequencies) are further combined into G groups. By default G = 10, but you can specify  with the NGROUPS= suboption of the LACKFIT
option in the MODEL
statement. Let F be the total frequency. The target frequency for each group is
with the NGROUPS= suboption of the LACKFIT
option in the MODEL
statement. Let F be the total frequency. The target frequency for each group is  , which is the integer part of
  . Load the first group (
 ) with the first of the 2,000 bins that has nonzero frequency
  , and let the next nonzero bin have a frequency of f. PROC HPLOGISTIC performs the following steps for each nonzero bin to create the groups:
-
If
 , then add this bin to group
  .
.
-
Otherwise, if
 and
and  , then add this bin to group .
-
Otherwise, start loading the next group (
 ) with
  , and set
  .
.
If the final group has frequency  , then add these observations to the preceding group. The total number of groups actually created, g, can be less than G.
The Hosmer-Lemeshow goodness-of-fit statistic is obtained by calculating the Pearson chi-square statistic from the  table of observed and expected frequencies. The statistic is written
![\[ \chi ^2_{\mathit{HL}} = \sum _{j=1}^ g \frac{(O_ j - F_ j \bar{\pi }_ j)^2}{F_ j \bar{\pi }_ j (1 - \bar{\pi }_ j)} \]](images/statug_hplogistic0129.png)
where, for the jth group ,  is the total frequency of subjects,
  is the total frequency of event outcomes, and
 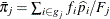 is the average estimated predicted probability of an event outcome. Let
  be the square root of the machine epsilon divided by 4,000, which is about 2.5E–12. Any
  is set to ; similarly, any
  is set to
  .
.
The Hosmer-Lemeshow statistic is compared to a chi-square distribution with  degrees of freedom. You can specify r with the DFREDUCE= suboption of the LACKFIT
option in the MODEL
statement. By default,
degrees of freedom. You can specify r with the DFREDUCE= suboption of the LACKFIT
option in the MODEL
statement. By default,  , and to compute the Hosmer-Lemeshow statistic you must have
  . Large values of
  (and small p-values) indicate a lack of fit of the model.