The KDE Procedure

Example 47.5 Univariate KDE Graphics
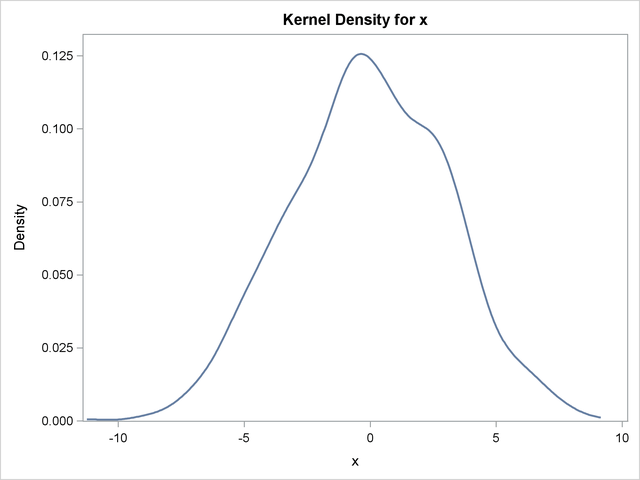
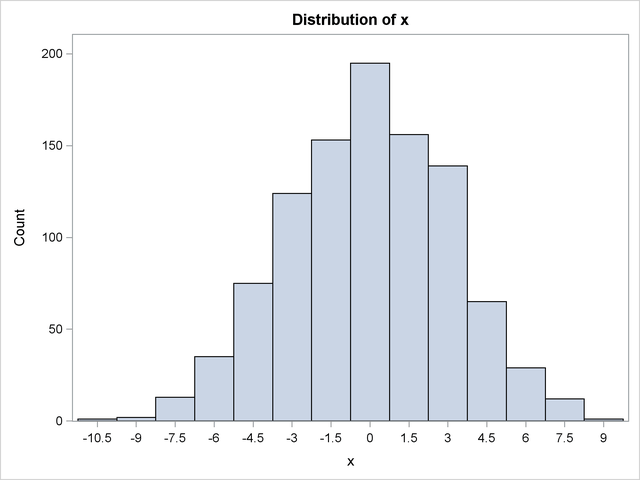
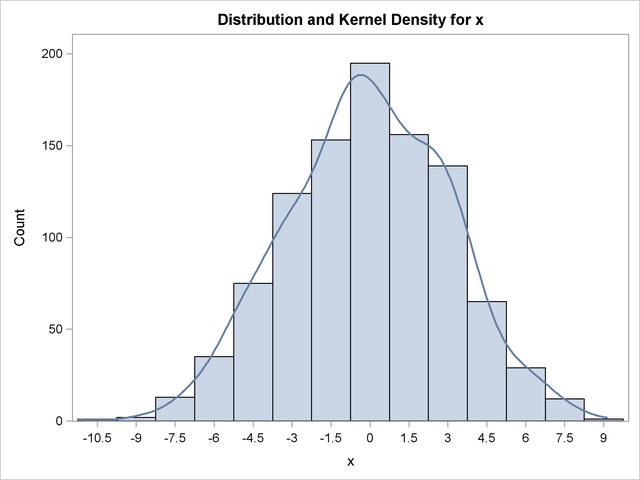
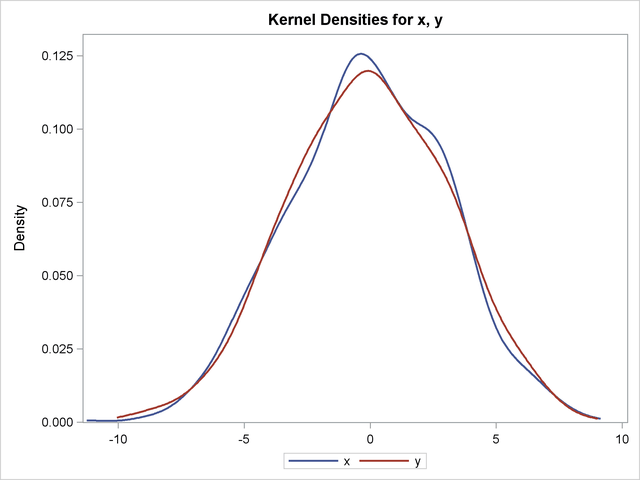
This example uses data from the section Getting Started: KDE Procedure to illustrate the use of ODS Graphics. The following statements request the available univariate plots in PROC KDE:
ods graphics on;
proc kde data=bivnormal;
   univar x / plots=(density histogram histdensity);
   univar x y / plots=densityoverlay;
run;
ods graphics off;
Graphs are requested by specifying the PLOTS= option in the UNIVAR statement with ODS Graphics enabled. Output 47.5.1, Output 47.5.2, and Output 47.5.3 show the kernel density estimate, histogram, and histogram with kernel density estimate overlaid, respectively, produced by the first UNIVAR statement.
Output 47.5.4 shows the plot produced by the second UNIVAR statement, in which the kernel density estimates for x and y are overlaid.
For general information about ODS Graphics, see Chapter 21, Statistical Graphics Using ODS. For specific information about the graphics available in the KDE procedure, see the section ODS Graphics.