The FREQ Procedure

Example 36.8 Cochran-Armitage Trend Test
The data set Pain contains hypothetical data for a clinical trial of a drug therapy to control pain. The clinical trial investigates whether adverse responses increase with larger drug doses. Subjects receive either a placebo or one of four drug doses. An adverse response is recorded as Adverse='Yes'; otherwise, it is recorded as Adverse='No'. The number of subjects for each drug dose and response combination is contained in the variable Count.
data pain;
   input Dose Adverse $ Count @@;
   datalines;
0 No 26   0 Yes  6
1 No 26   1 Yes  7
2 No 23   2 Yes  9
3 No 18   3 Yes 14
4 No  9   4 Yes 23
;
The following PROC FREQ statements provide a trend analysis. The TABLES statement requests a table of Adverse by Dose. The MEASURES option produces measures of association, and the CL option produces confidence limits for these measures. The TREND option tests for a trend across the ordinal values of the variable Dose with the Cochran-Armitage test. The EXACT statement produces exact  -values for this test, and the MAXTIME= option terminates the exact computations if they do not complete within 60 seconds. The TEST statement computes an asymptotic test for Somers’
  .
.
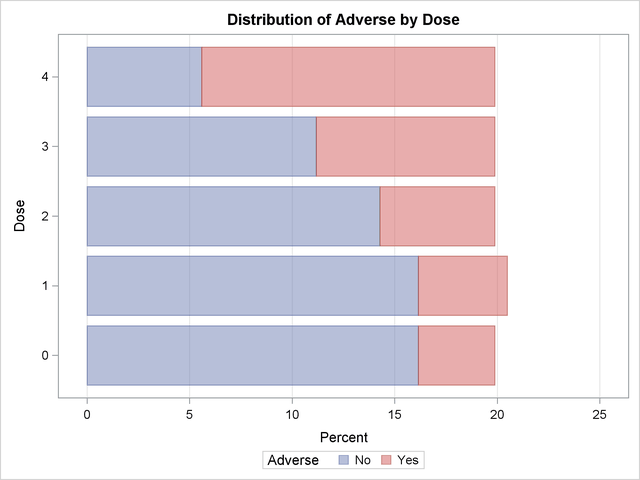
The PLOTS= option requests a frequency plot for the table of Adverse by Dose. By default, PROC FREQ provides a bar chart for the frequency plot. The TWOWAY=STACKED option requests a stacked layout, where the bars correspond to the column variable (Dose) values, and the row variable (Adverse) frequencies are stacked within each bar.
ods graphics on;
proc freq data=Pain;
   tables Adverse*Dose / trend measures cl
          plots=freqplot(twoway=stacked orient=horizontal scale=percent);
   test smdrc;
   exact trend / maxtime=60;
   weight Count;
   title 'Clinical Trial for Treatment of Pain';
run;
ods graphics off;
Output 36.8.1 through Output 36.8.4 display the results of the analysis. The "Col Pct" values in Output 36.8.1 show the expected increasing trend in the proportion of adverse effects with the increasing dosage (from 18.75% to 71.88%). The corresponding bar chart (Output 36.8.2) also shows this increasing trend.
| Clinical Trial for Treatment of Pain |
|
|
||||||||||||||||||||||||||||||||||||||||||||||||||||||||||||||||||||||||||||||||||||||||||||||||||||||||||
Output 36.8.3 displays the measures of association produced by the MEASURES option. Somers’ measures the association treating the row variable (Adverse) as the response and the column variable (Dose) as a predictor. Because the asymptotic 95% confidence limits do not contain zero, this indicates a strong positive association. Similarly, the Pearson and Spearman correlation coefficients show evidence of a strong positive association, as hypothesized.
The Cochran-Armitage test (Output 36.8.4) supports the trend hypothesis. The small left-sided -values for the Cochran-Armitage test indicate that the probability of the Row 1 level (Adverse='No') decreases as Dose increases or, equivalently, that the probability of the Row 2 level (Adverse='Yes') increases as Dose increases. The two-sided -value tests against either an increasing or decreasing alternative. This is an appropriate hypothesis when you want to determine whether the drug has progressive effects on the probability of adverse effects but the direction is unknown.
| Statistic | Value | ASE | 95% Confidence Limits |
|
|---|---|---|---|---|
| Gamma | 0.5313 | 0.0935 | 0.3480 | 0.7146 |
| Kendall's Tau-b | 0.3373 | 0.0642 | 0.2114 | 0.4631 |
| Stuart's Tau-c | 0.4111 | 0.0798 | 0.2547 | 0.5675 |
| Somers' D C|R | 0.4427 | 0.0837 | 0.2786 | 0.6068 |
| Somers' D R|C | 0.2569 | 0.0499 | 0.1592 | 0.3547 |
| Pearson Correlation | 0.3776 | 0.0714 | 0.2378 | 0.5175 |
| Spearman Correlation | 0.3771 | 0.0718 | 0.2363 | 0.5178 |
| Lambda Asymmetric C|R | 0.1250 | 0.0662 | 0.0000 | 0.2547 |
| Lambda Asymmetric R|C | 0.2373 | 0.0837 | 0.0732 | 0.4014 |
| Lambda Symmetric | 0.1604 | 0.0621 | 0.0388 | 0.2821 |
| Uncertainty Coefficient C|R | 0.0515 | 0.0191 | 0.0140 | 0.0890 |
| Uncertainty Coefficient R|C | 0.1261 | 0.0467 | 0.0346 | 0.2175 |
| Uncertainty Coefficient Symmetric | 0.0731 | 0.0271 | 0.0199 | 0.1262 |
| Somers' D R|C | |
|---|---|
| Somers' D R|C | 0.2569 |
| ASE | 0.0499 |
| 95% Lower Conf Limit | 0.1592 |
| 95% Upper Conf Limit | 0.3547 |
| Test of H0: Somers' D R|C = 0 | |
|---|---|
| ASE under H0 | 0.0499 |
| Z | 5.1511 |
| One-sided Pr > Z | <.0001 |
| Two-sided Pr > |Z| | <.0001 |
| Cochran-Armitage Trend Test | |
|---|---|
| Statistic (Z) | -4.7918 |
| Asymptotic Test | |
| One-sided Pr < Z | <.0001 |
| Two-sided Pr > |Z| | <.0001 |
| Exact Test | |
| One-sided Pr <= Z | 7.237E-07 |
| Two-sided Pr >= |Z| | 1.324E-06 |