The FREQ Procedure

Example 36.2 Frequency Dot Plots
This example produces frequency dot plots for the children’s eye and hair color data from Example 36.1.
PROC FREQ produces plots by using ODS Graphics to create graphs as part of the procedure output. Frequency plots are available for any frequency or crosstabulation table request. You can display frequency plots as bar charts or dot plots. You can use plot-options to specify the orientation (vertical or horizontal), scale, and layout of the plots.
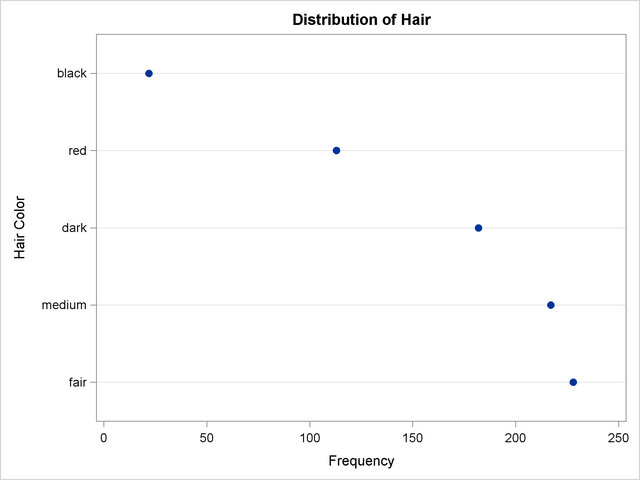
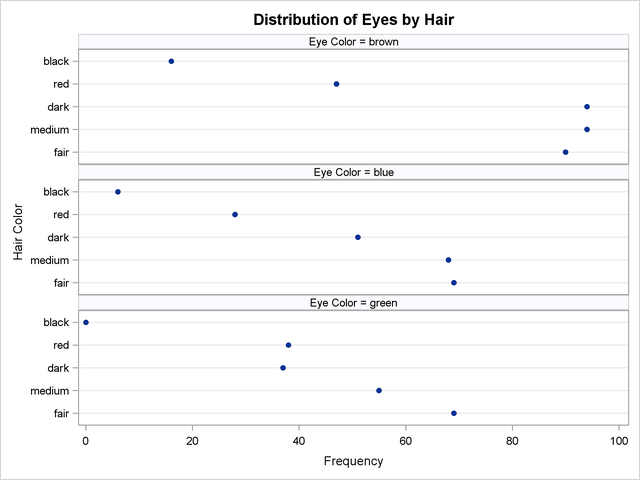
The following PROC FREQ statements request frequency tables and dot plots. The first TABLES statement requests a one-way frequency table of Hair and a crosstabulation table of Eyes by Hair. The PLOTS= option requests frequency plots for the tables, and the TYPE=DOTPLOT plot-option specifies dot plots. By default, frequency plots are produced as bar charts. ODS Graphics must be enabled before producing plots.
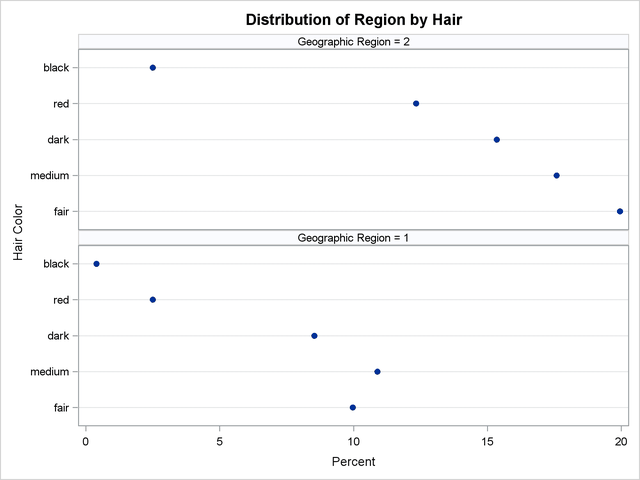
The second TABLES statement requests a crosstabulation table of Region by Hair and a frequency dot plot for this table. The SCALE=PERCENT plot-option plots percentages instead of frequency counts. SCALE=LOG and SCALE=SQRT plot-options are also available to plot log frequencies and square roots of frequencies, respectively.
The ORDER=FREQ option in the PROC FREQ statement orders the variable levels by frequency. This order applies to the frequency and crosstabulation table displays and also to the corresponding frequency plots.
ods graphics on;
proc freq data=Color order=freq;
   tables Hair Eyes*Hair / plots=freqplot(type=dotplot);
   tables Region*Hair / plots=freqplot(type=dotplot scale=percent);
   weight Count;
   title 'Eye and Hair Color of European Children';
run;
ods graphics off;
Output 36.2.1, Output 36.2.2, and Output 36.2.3 display the dot plots produced by PROC FREQ. By default, the orientation of dot plots is horizontal, which places the variable levels on the Y axis. You can specify the ORIENT=VERTICAL plot-option to request a vertical orientation. For two-way plots, you can use the TWOWAY= plot-option to specify the plot layout. The default layout (shown in Output 36.2.2 and Output 36.2.3) is GROUPVERTICAL. Two-way layouts STACKED and GROUPHORIZONTAL are also available.