The FREQ Procedure

Example 36.3 Chi-Square Goodness-of-Fit Tests
This example examines whether the children’s hair color (from Example 36.1) has a specified multinomial distribution for the two geographical regions. The hypothesized distribution of hair color is 30% fair, 12% red, 30% medium, 25% dark, and 3% black.
In order to test the hypothesis for each region, the data are first sorted by Region. Then the FREQ procedure uses a BY statement to produce a separate table for each BY group (Region). The option ORDER=DATA orders the variable values (hair color) in the frequency table by their order in the input data set. The TABLES statement requests a frequency table for hair color, and the option NOCUM suppresses the display of the cumulative frequencies and percentages.
The CHISQ option requests a chi-square goodness-of-fit test for the frequency table of Hair. The TESTP= option specifies the hypothesized (or test) percentages for the chi-square test; the number of percentages listed equals the number of table levels, and the percentages sum to 100%. The TESTP= percentages are listed in the same order as the corresponding variable levels appear in frequency table.
The PLOTS= option requests a deviation plot, which is associated with the CHISQ option and displays the relative deviations from the test frequencies. The TYPE=DOTPLOT plot-option requests a dot plot instead of the default type, which is a bar chart. ODS Graphics must be enabled before producing plots. These statements produce Output 36.3.1 through Output 36.3.4.
proc sort data=Color;
   by Region;
run;

ods graphics on;
proc freq data=Color order=data;
   tables Hair / nocum chisq testp=(30 12 30 25 3)
                 plots(only)=deviationplot(type=dotplot);
   weight Count;
   by Region;
   title 'Hair Color of European Children';
run;
ods graphics off;
| Hair Color of European Children |
| Hair Color | |||
|---|---|---|---|
| Hair | Frequency | Percent | Test Percent |
| fair | 76 | 30.89 | 30.00 |
| red | 19 | 7.72 | 12.00 |
| medium | 83 | 33.74 | 30.00 |
| dark | 65 | 26.42 | 25.00 |
| black | 3 | 1.22 | 3.00 |
| Chi-Square Test for Specified Proportions |
|
|---|---|
| Chi-Square | 7.7602 |
| DF | 4 |
| Pr > ChiSq | 0.1008 |
Output 36.3.1 shows the frequency table and chi-square test for Region 1. The frequency table lists the variable values (hair color) in the order in which they appear in the data set. The "Test Percent" column lists the hypothesized percentages for the chi-square test. Always check that you have ordered the TESTP= percentages to correctly match the order of the variable levels.
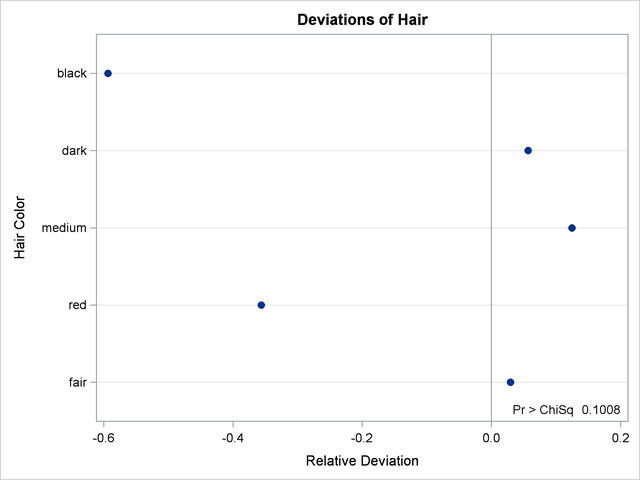
Output 36.3.2 shows the deviation plot for Region 1, which displays the relative deviations from the hypothesized values. The relative deviation for a level is the difference between the observed and hypothesized (test) percentage divided by the test percentage. You can suppress the chi-square p-value that is displayed by default in the deviation plot by specifying the NOSTATS plot-option.
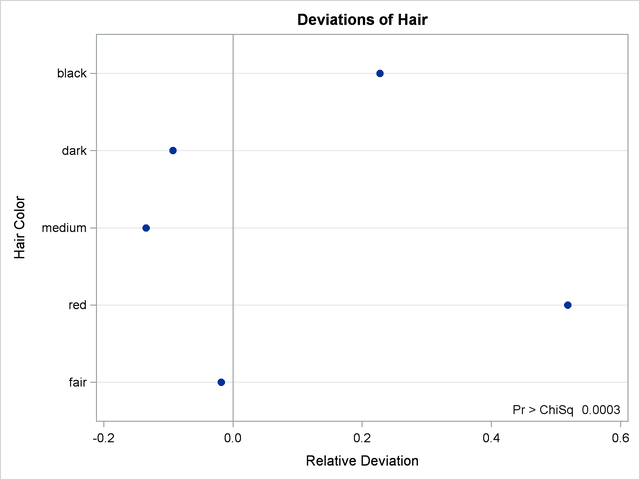
Output 36.3.3 and Output 36.3.4 show the results for Region 2. PROC FREQ computes a chi-square statistic for each region. The chi-square statistic is significant at the 0.05 level for Region 2 ( =0.0003) but not for Region 1. This indicates a significant departure from the hypothesized percentages in Region 2.
| Hair Color of European Children |
| Hair Color | |||
|---|---|---|---|
| Hair | Frequency | Percent | Test Percent |
| fair | 152 | 29.46 | 30.00 |
| red | 94 | 18.22 | 12.00 |
| medium | 134 | 25.97 | 30.00 |
| dark | 117 | 22.67 | 25.00 |
| black | 19 | 3.68 | 3.00 |
| Chi-Square Test for Specified Proportions |
|
|---|---|
| Chi-Square | 21.3824 |
| DF | 4 |
| Pr > ChiSq | 0.0003 |