PLOT Procedure
- Syntax

- Overview
- Concepts
- Results
- Examples Specifying a Plotting SymbolControlling the Horizontal Axis and Adding a Reference LineOverlaying Two PlotsProducing Multiple Plots per PagePlotting Data on a Logarithmic ScalePlotting Date Values on an AxisProducing a Contour PlotPlotting BY GroupsAdding Labels to a PlotExcluding Observations That Have Missing ValuesAdjusting Labels on a Plot with the PLACEMENT= OptionAdjusting Labeling on a Plot with a MacroChanging a Default Penalty
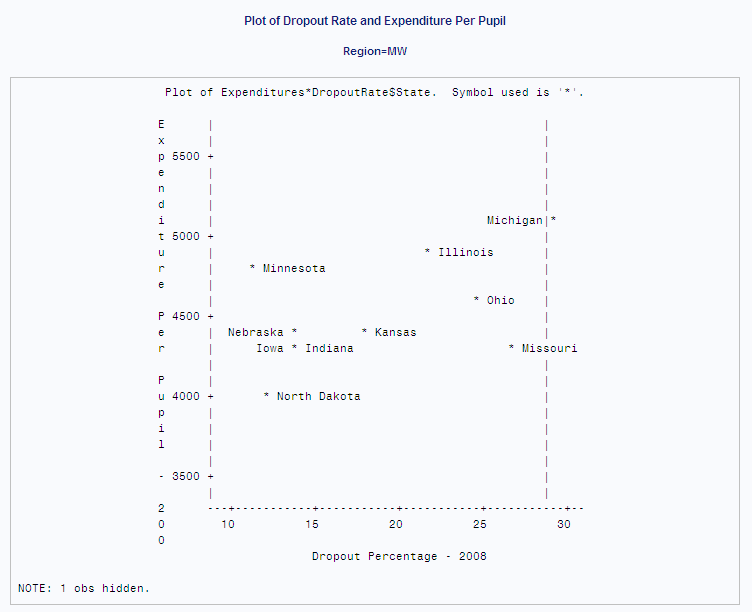
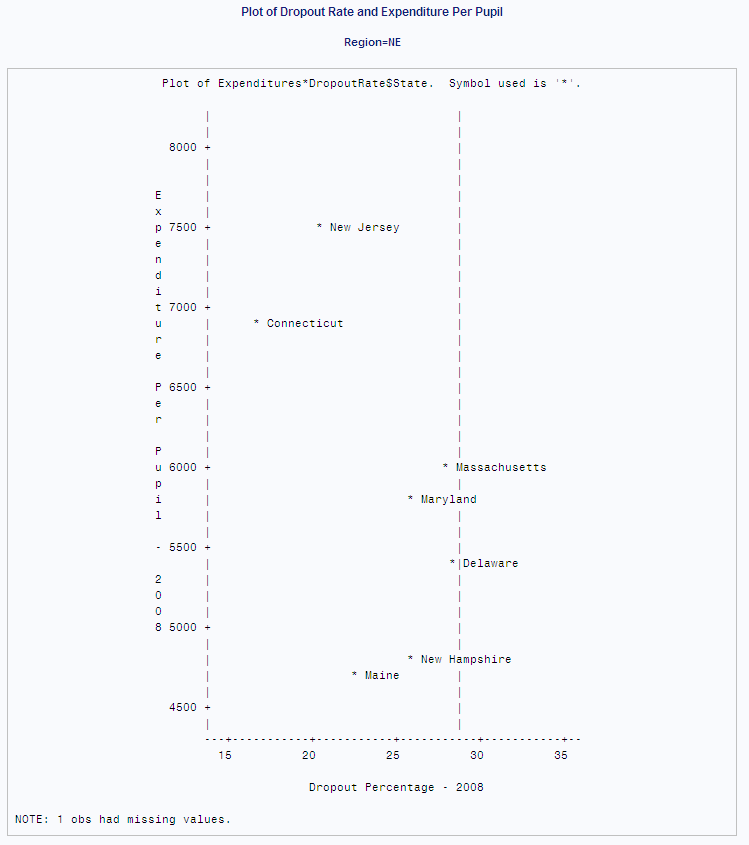
Example 9: Adding Labels to a Plot
| Features: |
PLOT statement : label variable in plot request |
| Data set: | EDUCATION |
This example shows how
to modify the plot request to label points on the plot with the values
of variables. This
example adds labels to the plot shown in Plotting BY Groups.
Program
options formchar="|----|+|---+=|-/\<>*";
proc sort data=education;
   by region;
run;
proc plot data=education;
   by region;
   plot expenditures*dropoutrate='*' $ state / href=28.6
        vaxis=by 500 vspace=5
        haxis=by 5 hspace=12;
   title 'Plot of Dropout Rate and Expenditure Per Pupil';
run;
Program Description
Set the FORMCHAR option.Setting
FORMCHAR to this exact string renders better HTML output when it is
viewed outside of the SAS environment where SAS Monospace fonts are
not available.
Sort the EDUCATION data set. PROC
SORT sorts EDUCATION by Region so that Region can be used as the BY
variable in PROC PLOT.
Create a separate plot for each BY group. The BY statement creates a separate plot for each
value of Region.
Create the plot with a reference line and a label for
each data point. The plot request plots
Expenditures on the vertical axis, plots DropoutRate on the horizontal
axis, and specifies an asterisk as the plotting symbol. The label
variable specification ($ state)
in the PLOT statement labels each point on the plot with the name
of the corresponding state. HREF= draws a reference line that extends
from 28.6 on the horizontal axis. The reference line represents the
national average. VAXIS and HAXIS are used to set the tick marks along
the vertical and horizontal axes.