PLOT Procedure
- Syntax

- Overview
- Concepts
- Results
- Examples Specifying a Plotting SymbolControlling the Horizontal Axis and Adding a Reference LineOverlaying Two PlotsProducing Multiple Plots per PagePlotting Data on a Logarithmic ScalePlotting Date Values on an AxisProducing a Contour PlotPlotting BY GroupsAdding Labels to a PlotExcluding Observations That Have Missing ValuesAdjusting Labels on a Plot with the PLACEMENT= OptionAdjusting Labeling on a Plot with a MacroChanging a Default Penalty
Example 12: Adjusting Labeling on a Plot with a Macro
| Features: |
|
| Data set: | CENSUS |
This example illustrates
the default placement of labels and uses a macro to adjust the placement
of labels. The labels are values of a variable in the data set.
Program
options formchar="|----|+|---+=|-/\<>*";
%macro place(n);
   %if &n > 13 %then %let n = 13;
       placement=(
   %if &n <= 0 %then (s=center); %else (h=2 -2 : s=right left);
   %if &n = 1 %then (v=1 * h=0 -1 to -2 by alt);
   %else %if &n = 2 %then (v=1 -1 * h=0 -1 to -5 by alt);
   %else %if &n > 2 %then (v=1 to 2 by alt * h=0 -1 to -10 by alt);
   %if &n > 3 %then
       (s=center right left * v=0 1 to %eval(&n - 2) by alt *
       h=0 -1 to %eval(-3 * (&n - 2)) by alt *
       l=1 to %eval(2 + (10 * &n - 35) / 30)); )
   %if &n > 4 %then penalty(7)=%eval((3 * &n) / 2);
%mend;
proc plot data=census;
   plot density*crimerate=state $ state /
           box
           list=1
           haxis=by 1000
           vaxis=by 250
           vspace=12
           %place(4);
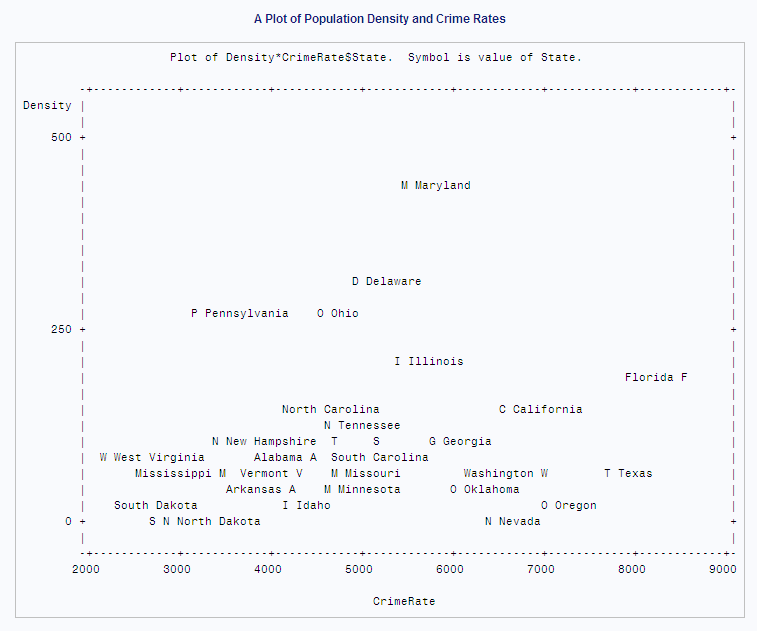
   title 'A Plot of Population Density and Crime Rates';
run;
Program Description
Set the FORMCHAR option.Setting
FORMCHAR to this exact string renders better HTML output when it is
viewed outside of the SAS environment where SAS Monospace fonts are
not available.
Use conditional logic to determine placement.The %PLACE macro provides an alternative to using
the PLACEMENT= option. The higher the value of n , the more freedom
PROC PLOT has to place labels.
%macro place(n);
   %if &n > 13 %then %let n = 13;
       placement=(
   %if &n <= 0 %then (s=center); %else (h=2 -2 : s=right left);
   %if &n = 1 %then (v=1 * h=0 -1 to -2 by alt);
   %else %if &n = 2 %then (v=1 -1 * h=0 -1 to -5 by alt);
   %else %if &n > 2 %then (v=1 to 2 by alt * h=0 -1 to -10 by alt);
   %if &n > 3 %then
       (s=center right left * v=0 1 to %eval(&n - 2) by alt *
       h=0 -1 to %eval(-3 * (&n - 2)) by alt *
       l=1 to %eval(2 + (10 * &n - 35) / 30)); )
   %if &n > 4 %then penalty(7)=%eval((3 * &n) / 2);
%mend;
Create the plot.The plot
request plots Density on the vertical axis, CrimeRate on the horizontal
axis, and uses the first letter of the value of State as the plotting
symbol. The label variable specification ($ state ) in the PLOT statement
t labels each point with the corresponding state name.