PLOT Procedure
- Syntax

- Overview
- Concepts
- Results
- Examples Specifying a Plotting SymbolControlling the Horizontal Axis and Adding a Reference LineOverlaying Two PlotsProducing Multiple Plots per PagePlotting Data on a Logarithmic ScalePlotting Date Values on an AxisProducing a Contour PlotPlotting BY GroupsAdding Labels to a PlotExcluding Observations That Have Missing ValuesAdjusting Labels on a Plot with the PLACEMENT= OptionAdjusting Labeling on a Plot with a MacroChanging a Default Penalty
Example 8: Plotting BY Groups
| Features: |
PLOT statement option:: HREF= |
| Other features: |
BY statement |
| Data set: | EDUCATION |
Program
options formchar="|----|+|---+=|-/\<>*";
data education;
   input State $14. +1 Code $ DropoutRate Expenditures MathScore
         Region $;
   label dropout='Dropout Percentage - 1989'
          expend='Expenditure Per Pupil - 1989'
            math='8th Grade Math Exam - 1990';
   datalines;
Alabama        AL 22.3 3197 252 SE
Alaska         AK 35.8 7716 .   W
...more data lines...
New York       NY 35.0 .    261 NE
North Carolina NC 31.2 3874 250 SE
North Dakota   ND 12.1 3952 281 MW
Ohio           OH 24.4 4649 264 MW
;
proc sort data=education;
   by region;
run;
proc plot data=education;
   by region;
    plot expenditures*dropoutrate='*' / href=28.6
         vaxis=by 500 vspace=5
         haxis=by 5 hspace=12;
    title 'Plot of Dropout Rate and Expenditure Per Pupil';
 run;
Program Description
Set the FORMCHAR option.Setting
FORMCHAR to this exact string renders better HTML output when it is
viewed outside of the SAS environment where SAS Monospace fonts are
not available.
Create the EDUCATION data set. EDUCATION
contains educational data (Source: U.S. Department of Education) about
some U.S. states. DropoutRate is the percentage of high school dropouts.
Expenditures is the dollar amount the state spends on each pupil.
MathScore is the score of eighth-grade students on a standardized
math test. Not all states participated in the math test. The EDUCATION DATA step creates this data set.
data education;
   input State $14. +1 Code $ DropoutRate Expenditures MathScore
         Region $;
   label dropout='Dropout Percentage - 1989'
          expend='Expenditure Per Pupil - 1989'
            math='8th Grade Math Exam - 1990';
   datalines;
Alabama        AL 22.3 3197 252 SE
Alaska         AK 35.8 7716 .   W
...more data lines...
New York       NY 35.0 .    261 NE
North Carolina NC 31.2 3874 250 SE
North Dakota   ND 12.1 3952 281 MW
Ohio           OH 24.4 4649 264 MW
;
Sort the EDUCATION data set. PROC
SORT sorts EDUCATION by Region so that Region can be used as the BY
variable in PROC PLOT.
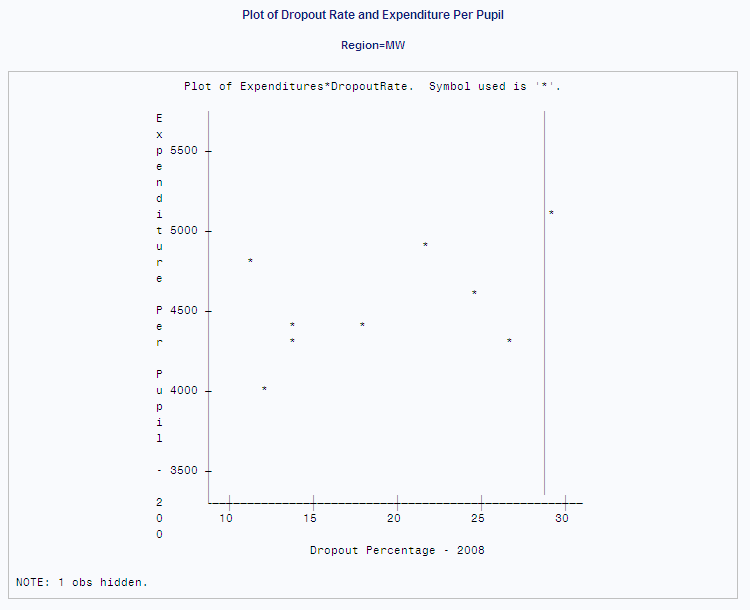
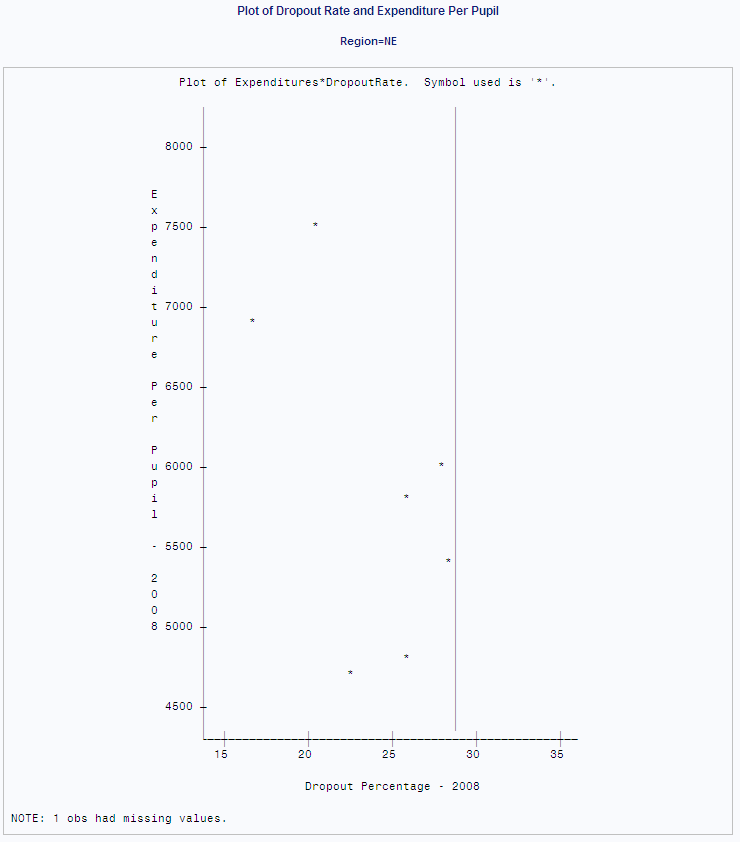
Create a separate plot for each BY group. The BY statement creates a separate plot for each
value of Region.
Create the plot with a reference line. The plot request plots Expenditures on the vertical
axis, plots DropoutRate on the horizontal axis, and specifies an asterisk
as the plotting symbol. HREF= draws a reference line that extends
from 28.6 on the horizontal axis. The reference line represents the
national average. VAXIS and HAXIS are used to set the tick marks along
the vertical and horizontal axes.